[!!!] Plot spectroscopic curves
qplot_spc.RdPlot spectroscopic curves in different colors.
[ DESCRIPTION MUST BE UPDATED ]
qplot_spc(
sp,
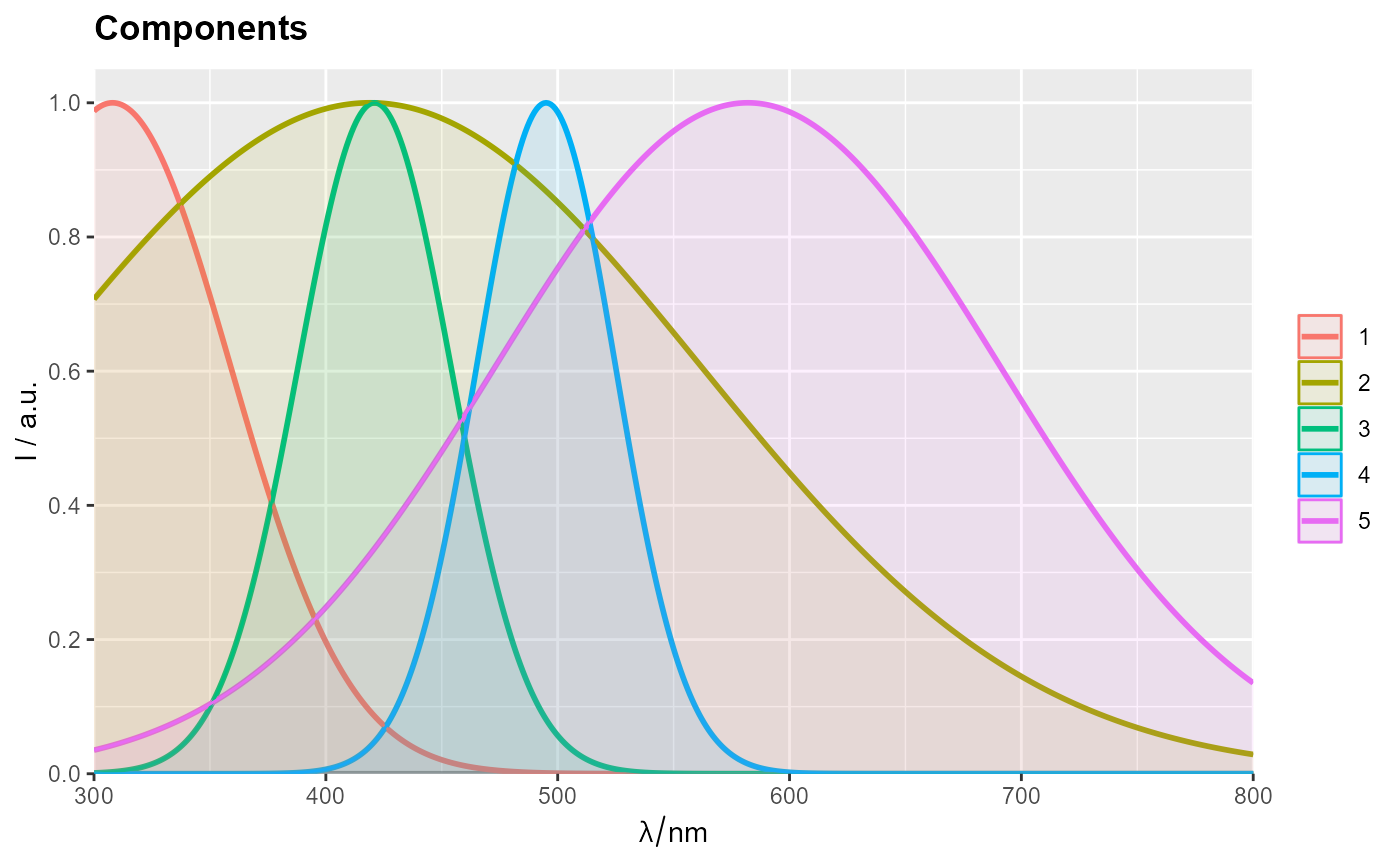
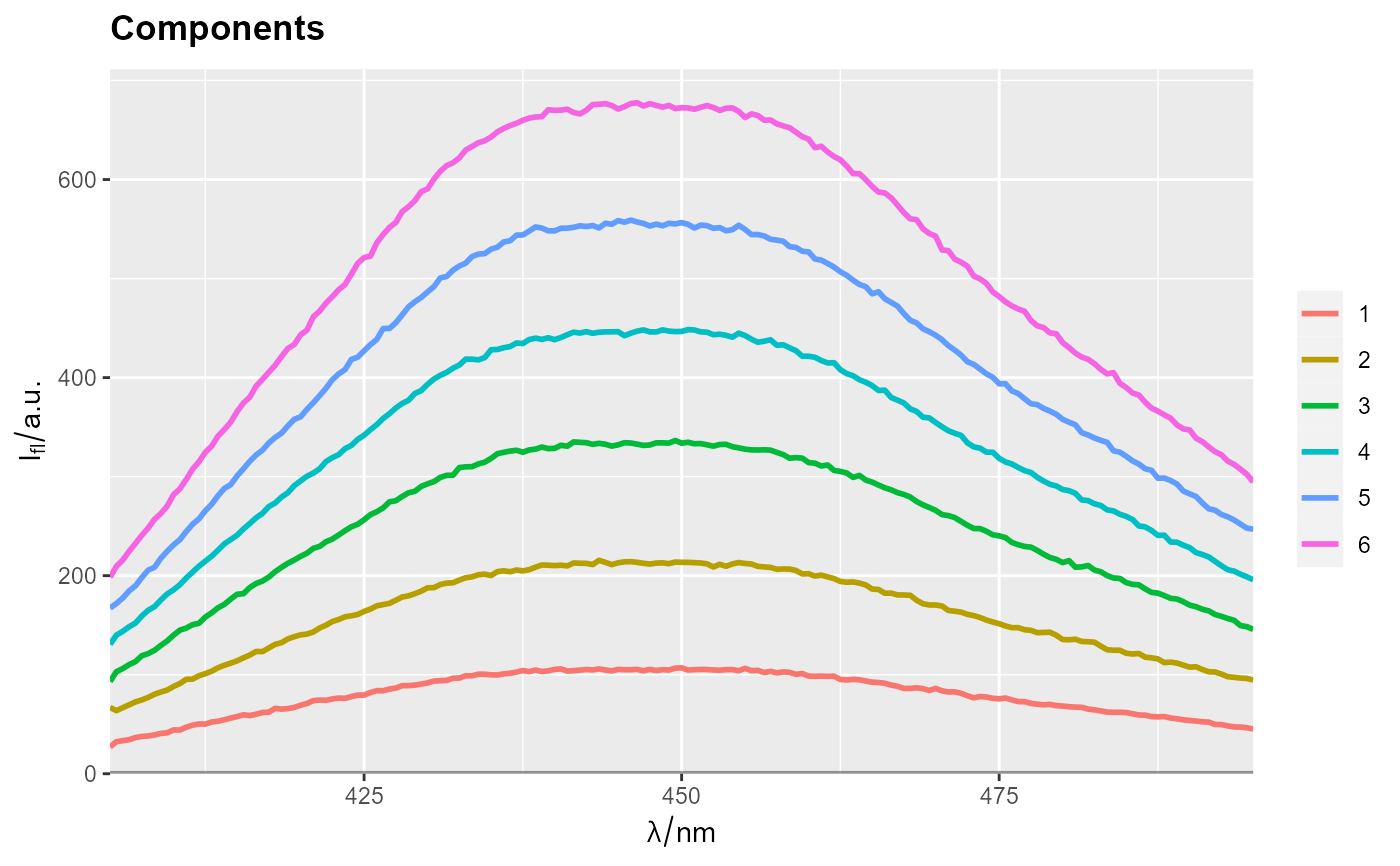
Title = "Components",
xLabel = labels(sp, ".wavelength"),
yLabel = labels(sp, "spc"),
by = "cNames",
palette = hyGet_palette(sp),
legendName = FALSE,
filled = TRUE,
normalize = FALSE,
facets = FALSE,
subTitle = NULL,
names.in = NULL,
line_size = 1,
add = FALSE,
...
)
gg_spc(sp, by = "cNames", line_size = 1, ...)Arguments
- sp
hyperSpecobject.- Title
The main title for the plot.
- xLabel
A label for abscisa (x) axis.
- yLabel
A label for ordinate (y) axis.
- by
A name of variable in
spthat contains variable names. If indicated variable does not exist, row names are used instead.
Default isnames = 'cNames'- legendName
A name of a legend. Possible entries:
logical
FALSE- a legend without a name;logical
TRUE- a label of a variablenameis used as a name of a legend (legendName <- labels(sp,name));...manual input of the name.
- filled
Logical. If
TRUE, colored fill is used. IfFALSE, no fill is used. (Fill is an area between ordinate axis and the curve.)- normalize
A flag that indicates whether components should be normalized before plotting. Possible selections:
FALSE,0- do not normalize;TRUE,+1- normalize to max value;-TRUE,-1- normalize to min value [! this choise can give unexpected results];"auto"- one of the choices above is selected by determining if spectra have any possitive and any negative peaks:Below0 <- any(sp$spc < 0);Above0 <- any(sp$spc > 0);normalize <- (Above0 - Below0)
- facets
A logical flag. If
TRUE, spectra are plotted on separate graphs/facets (implemented by functionfacet_grid). IfFALSE, all spectra are plotted on one facet.- subTitle
The second line of title, which will be smaller and and in italics.
- names.in
DEPRECATED. Use
byinstead.- ...
further arguments to geom_line.
Value
A ggplot object.
More details in package ggplot2.
Details
qplot_kSp plots spectra on one graph. qplot_kSpFacets plots spectra on separate graphs (facets).
Note
Before using as an argument sp,
a matrix of components/loadings (sp) must be treated
with function decomposition (or equivalent)
which converts it to hyperSpec object.
See also
Other spHelper plots:
check_palette(),
layer_spRangeMean(),
plot_colors(),
plot_hyPalette(),
plot_spCompare(),
plot_spDiff(),
plot_spDistribution(),
qplot_confusion(),
qplot_crosstab(),
qplot_infoDim(),
qplot_kAmp(),
qplot_kSp(),
qplot_prediction(),
qplot_spRangeCenter(),
qplot_spRangeMedian(),
qplot_spStat(),
rmExpr(),
rm_stripes(),
stat_chull()
Other component analysis / factorisation related functions in spHelper:
getScores(),
infoDim(),
plot_spDiff(),
qplot_infoDim(),
qplot_kAmp(),
qplot_kSp(),
reconstructSp(),
sortLoadings(),
unipeak(),
whichOutlier()
Examples
library(spHelper)
library(spPlot)
ggplot() +
qplot_spc(sp, by = "gr", add = TRUE, alpha = .2) +
qplot_spStat(sp,"gr", mean, add = TRUE)
#> Error in hyGet_palette0(sp): object 'sp' not found
qplot_kSp(Loadings2)
#> Warning: Function 'hyperSpec::chk.hy' is deprecated.
#> Use function 'assert_hyperSpec' instead.
 data(flu, package = "hyperSpec")
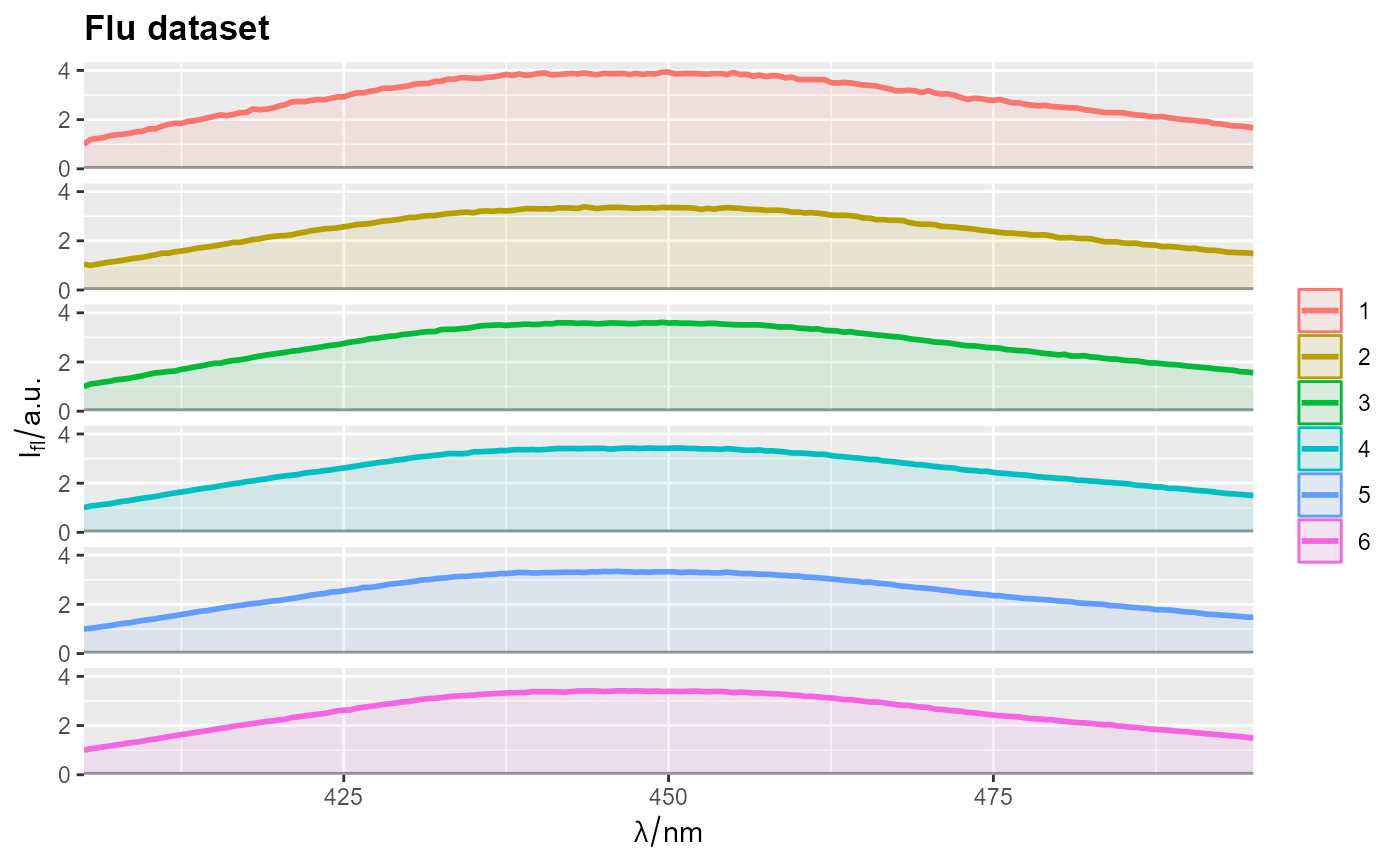
qplot_kSpFacets(flu, Title = "Flu dataset")
#> Warning: Function 'hyperSpec::chk.hy' is deprecated.
#> Use function 'assert_hyperSpec' instead.
data(flu, package = "hyperSpec")
qplot_kSpFacets(flu, Title = "Flu dataset")
#> Warning: Function 'hyperSpec::chk.hy' is deprecated.
#> Use function 'assert_hyperSpec' instead.
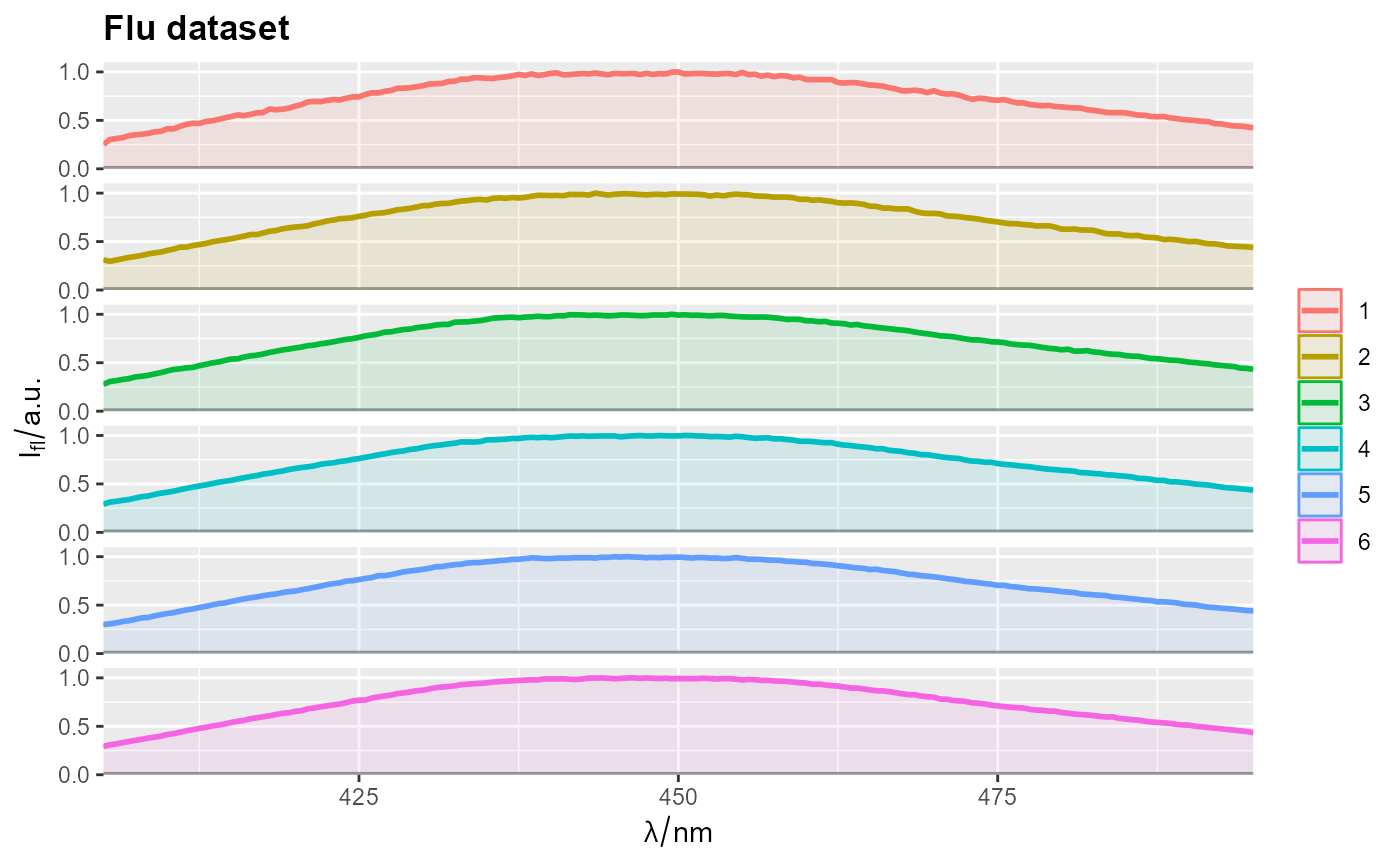 qplot_kSpFacets(flu, Title = "Flu dataset", normalize = 1)
#> Warning: Function 'hyperSpec::chk.hy' is deprecated.
#> Use function 'assert_hyperSpec' instead.
qplot_kSpFacets(flu, Title = "Flu dataset", normalize = 1)
#> Warning: Function 'hyperSpec::chk.hy' is deprecated.
#> Use function 'assert_hyperSpec' instead.
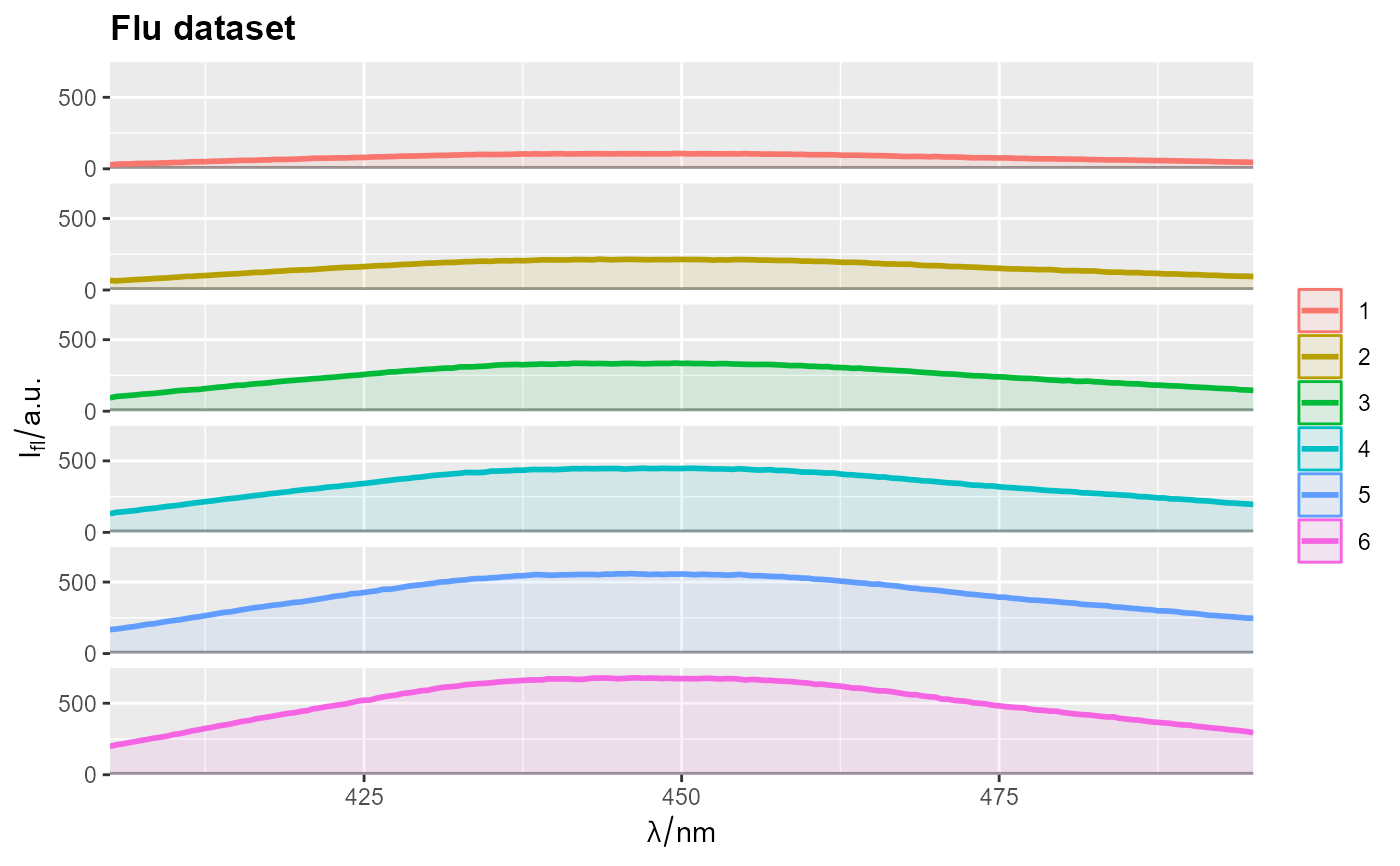
 qplot_kSpFacets(flu, Title = "Flu dataset", normalize = FALSE)
#> Warning: Function 'hyperSpec::chk.hy' is deprecated.
#> Use function 'assert_hyperSpec' instead.
qplot_kSpFacets(flu, Title = "Flu dataset", normalize = FALSE)
#> Warning: Function 'hyperSpec::chk.hy' is deprecated.
#> Use function 'assert_hyperSpec' instead.
 qplot_kSpFacets(flu, Title = "Flu dataset", normalize = -1)
#> Warning: Function 'hyperSpec::chk.hy' is deprecated.
#> Use function 'assert_hyperSpec' instead.
qplot_kSpFacets(flu, Title = "Flu dataset", normalize = -1)
#> Warning: Function 'hyperSpec::chk.hy' is deprecated.
#> Use function 'assert_hyperSpec' instead.
 ## Remove fill -----------------------------------------------------------------
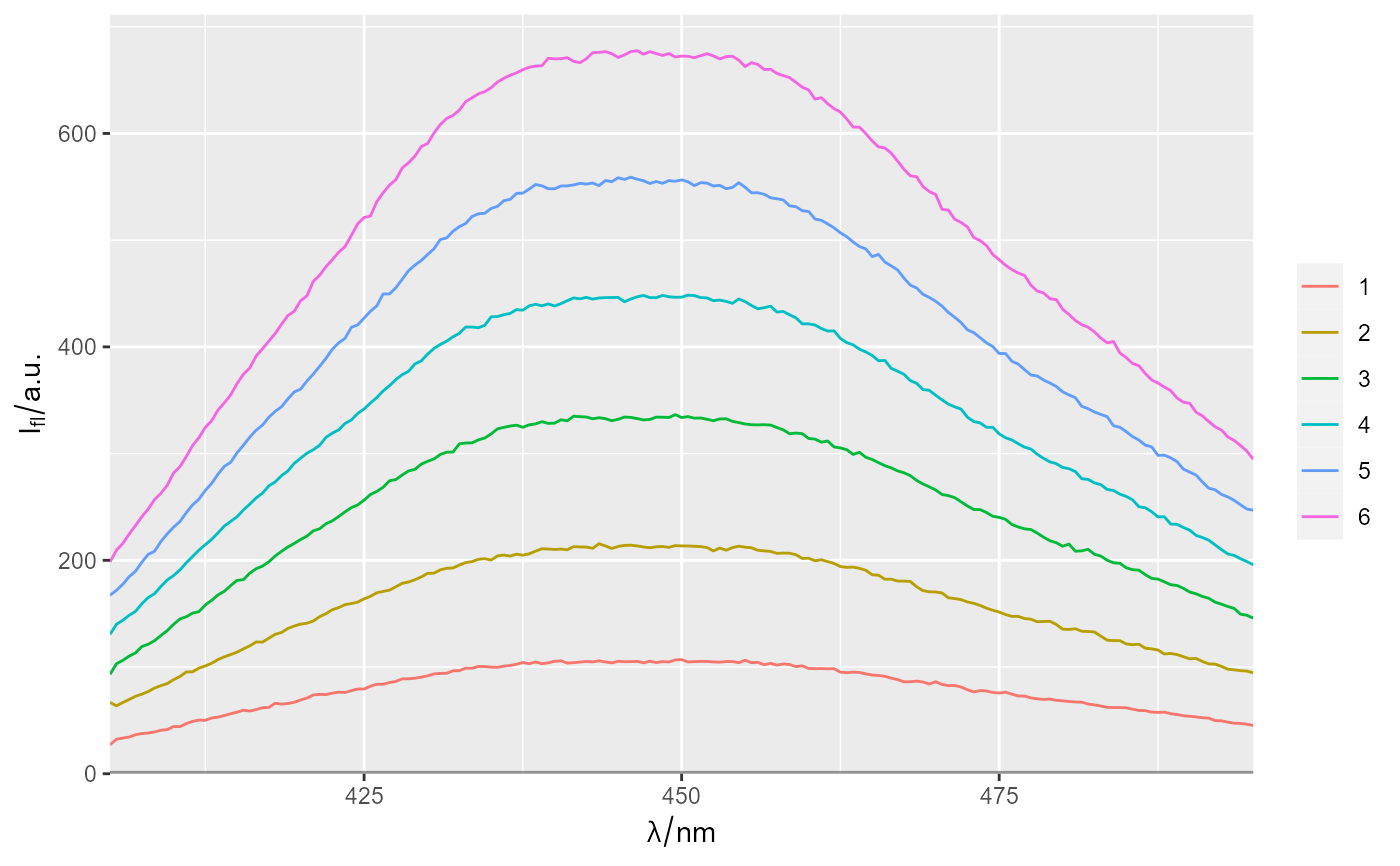
qplot_kSp(flu, filled = FALSE)
#> Warning: Function 'hyperSpec::chk.hy' is deprecated.
#> Use function 'assert_hyperSpec' instead.
## Remove fill -----------------------------------------------------------------
qplot_kSp(flu, filled = FALSE)
#> Warning: Function 'hyperSpec::chk.hy' is deprecated.
#> Use function 'assert_hyperSpec' instead.
 qplot_sp(flu)
#> Warning: Function 'hyperSpec::chk.hy' is deprecated.
#> Use function 'assert_hyperSpec' instead.
qplot_sp(flu)
#> Warning: Function 'hyperSpec::chk.hy' is deprecated.
#> Use function 'assert_hyperSpec' instead.
 ## Name of a legend ------------------------------------------------------------
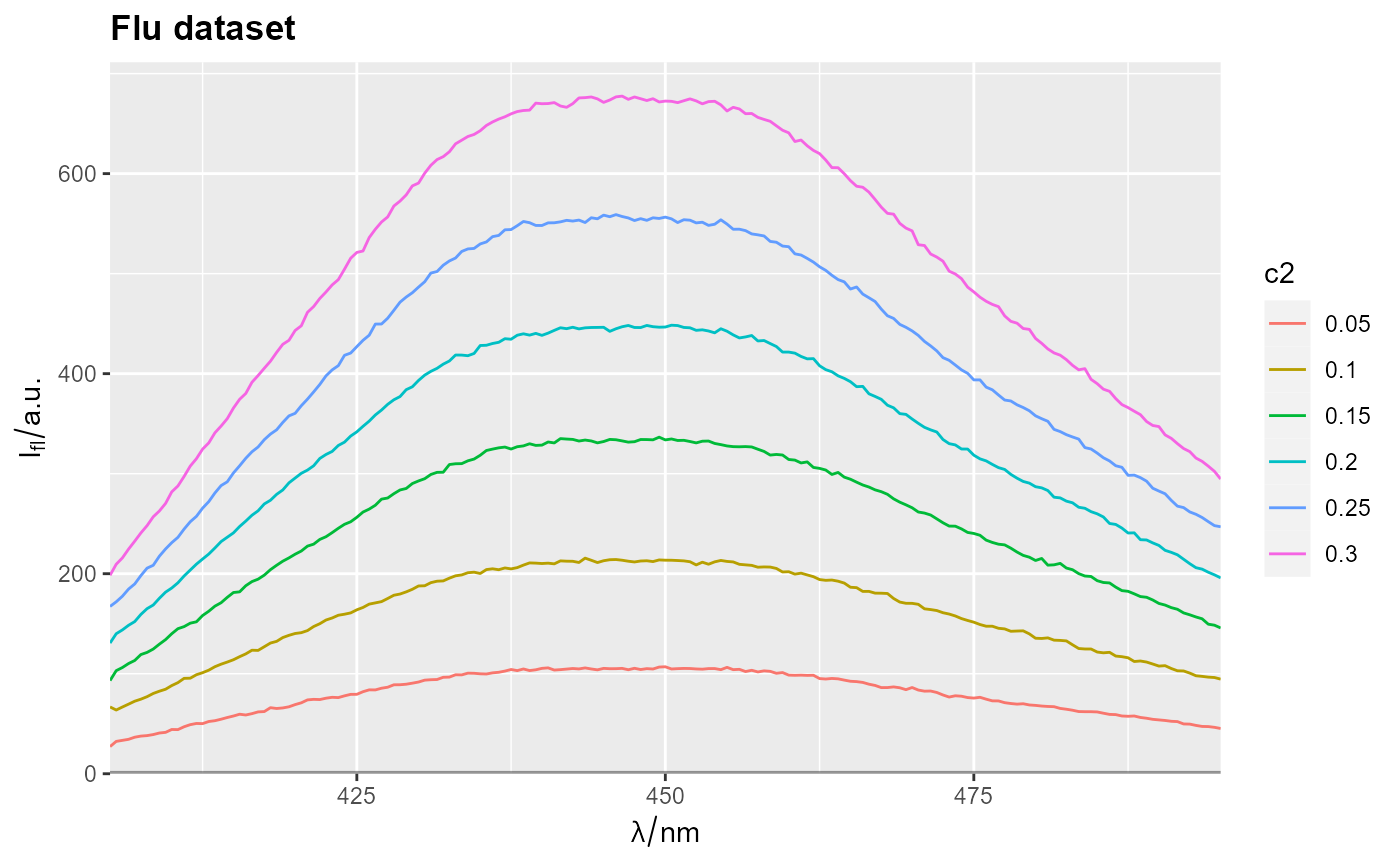
flu$c2 <- as.factor(flu$c)
qplot_sp(flu, Title = "Flu dataset", by = 'c2', legendName = FALSE)
#> Warning: Function 'hyperSpec::chk.hy' is deprecated.
#> Use function 'assert_hyperSpec' instead.
## Name of a legend ------------------------------------------------------------
flu$c2 <- as.factor(flu$c)
qplot_sp(flu, Title = "Flu dataset", by = 'c2', legendName = FALSE)
#> Warning: Function 'hyperSpec::chk.hy' is deprecated.
#> Use function 'assert_hyperSpec' instead.
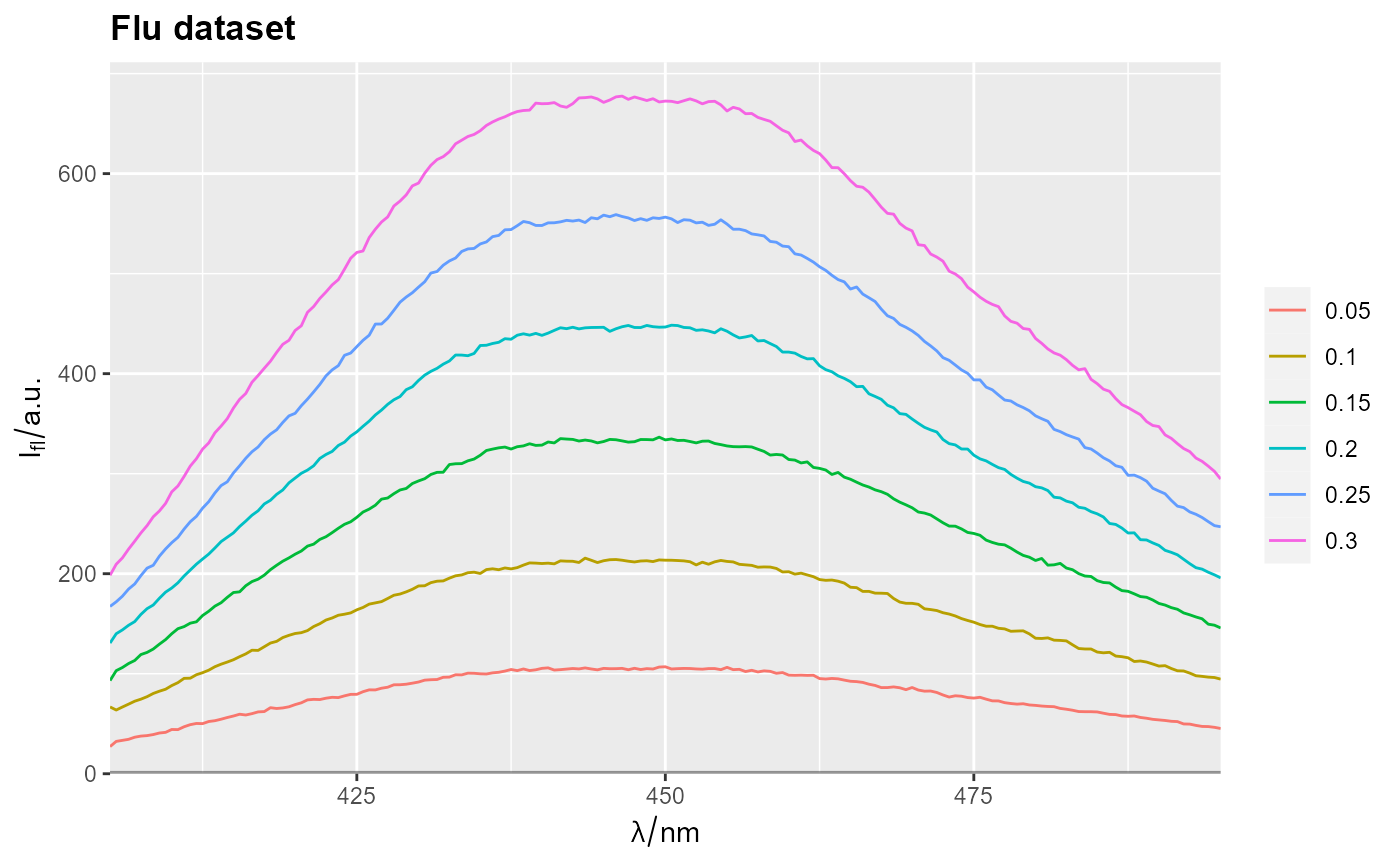 qplot_sp(flu, Title = "Flu dataset", by = 'c2', legendName = TRUE)
#> Warning: Function 'hyperSpec::chk.hy' is deprecated.
#> Use function 'assert_hyperSpec' instead.
qplot_sp(flu, Title = "Flu dataset", by = 'c2', legendName = TRUE)
#> Warning: Function 'hyperSpec::chk.hy' is deprecated.
#> Use function 'assert_hyperSpec' instead.
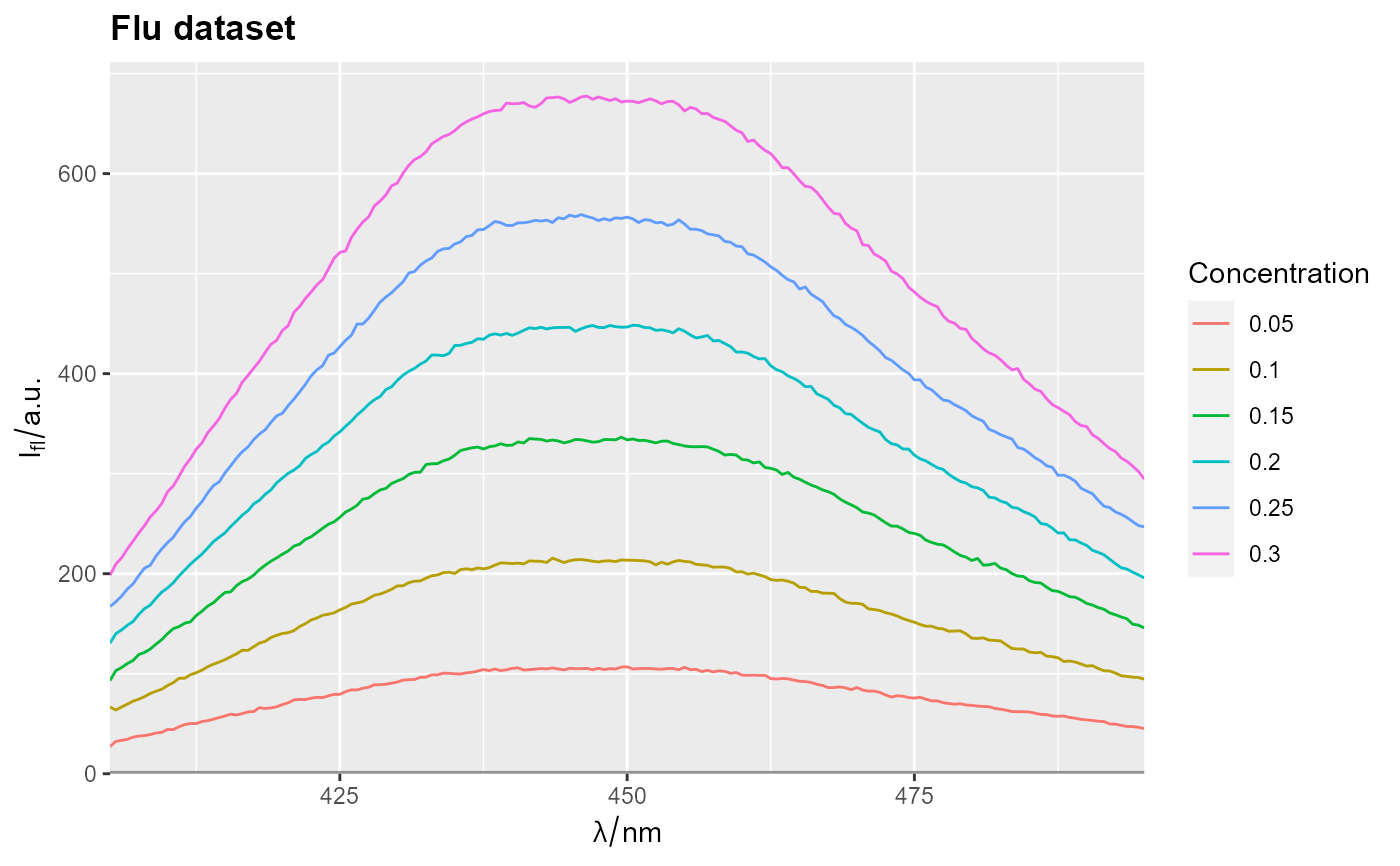
 qplot_sp(flu, Title = "Flu dataset", by = 'c2', legendName = "Concentration")
#> Warning: Function 'hyperSpec::chk.hy' is deprecated.
#> Use function 'assert_hyperSpec' instead.
qplot_sp(flu, Title = "Flu dataset", by = 'c2', legendName = "Concentration")
#> Warning: Function 'hyperSpec::chk.hy' is deprecated.
#> Use function 'assert_hyperSpec' instead.
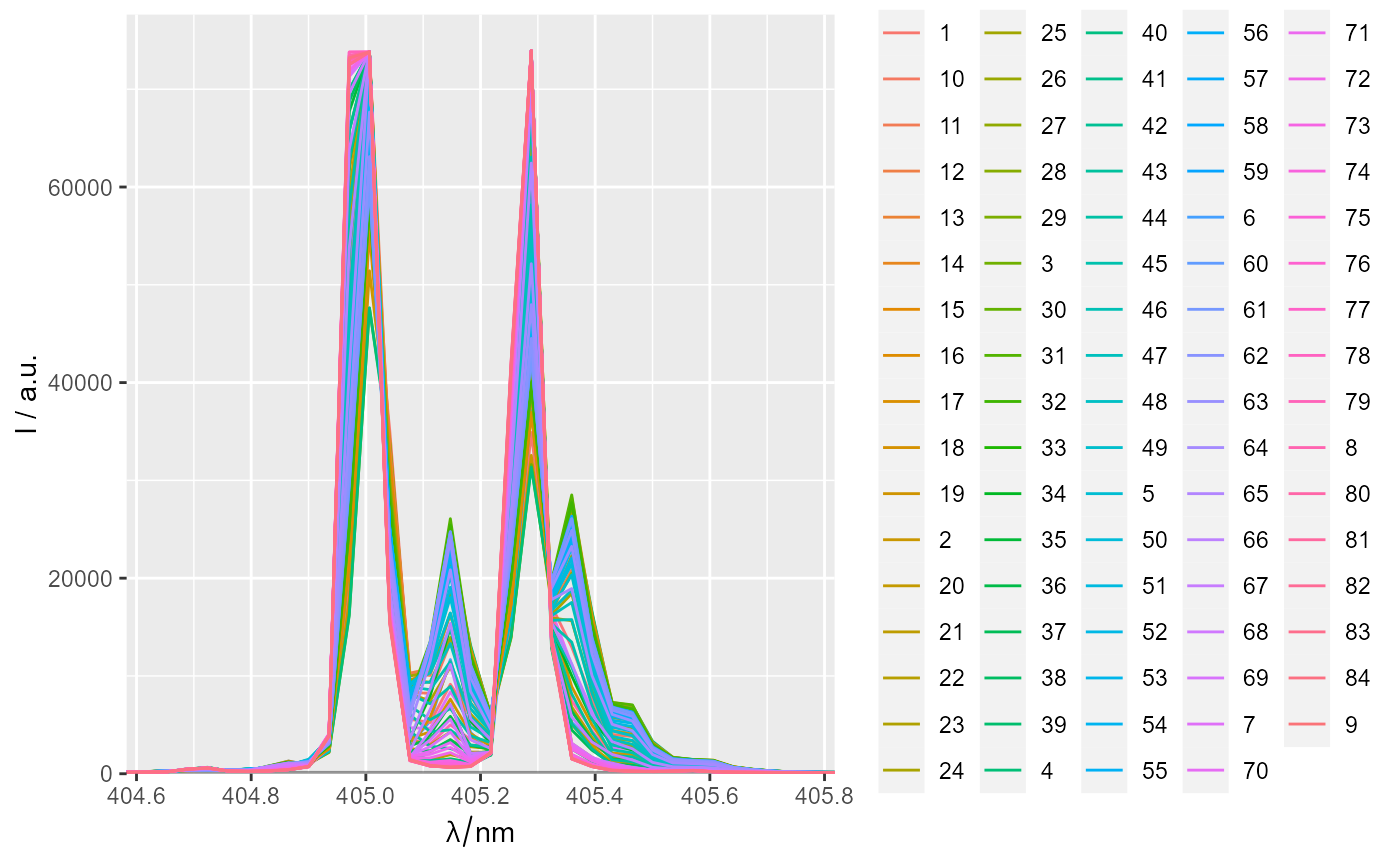
 ## Example of line color transitions -------------------------------------------
qplot_sp(laser)
#> Warning: Function 'hyperSpec::chk.hy' is deprecated.
#> Use function 'assert_hyperSpec' instead.
## Example of line color transitions -------------------------------------------
qplot_sp(laser)
#> Warning: Function 'hyperSpec::chk.hy' is deprecated.
#> Use function 'assert_hyperSpec' instead.