Calculate information dimension of a matix
infoDim.RdThe function calculates a measure, called "information dimension".
infoDim(Matrix)Arguments
- Matrix
A matrix with data (rows = observations, columns = variables).
Value
A list (classes "list" and "infoDim") with fields:
- $dim
Information dimension, rounded towards positive infinitive;
- $exactDim
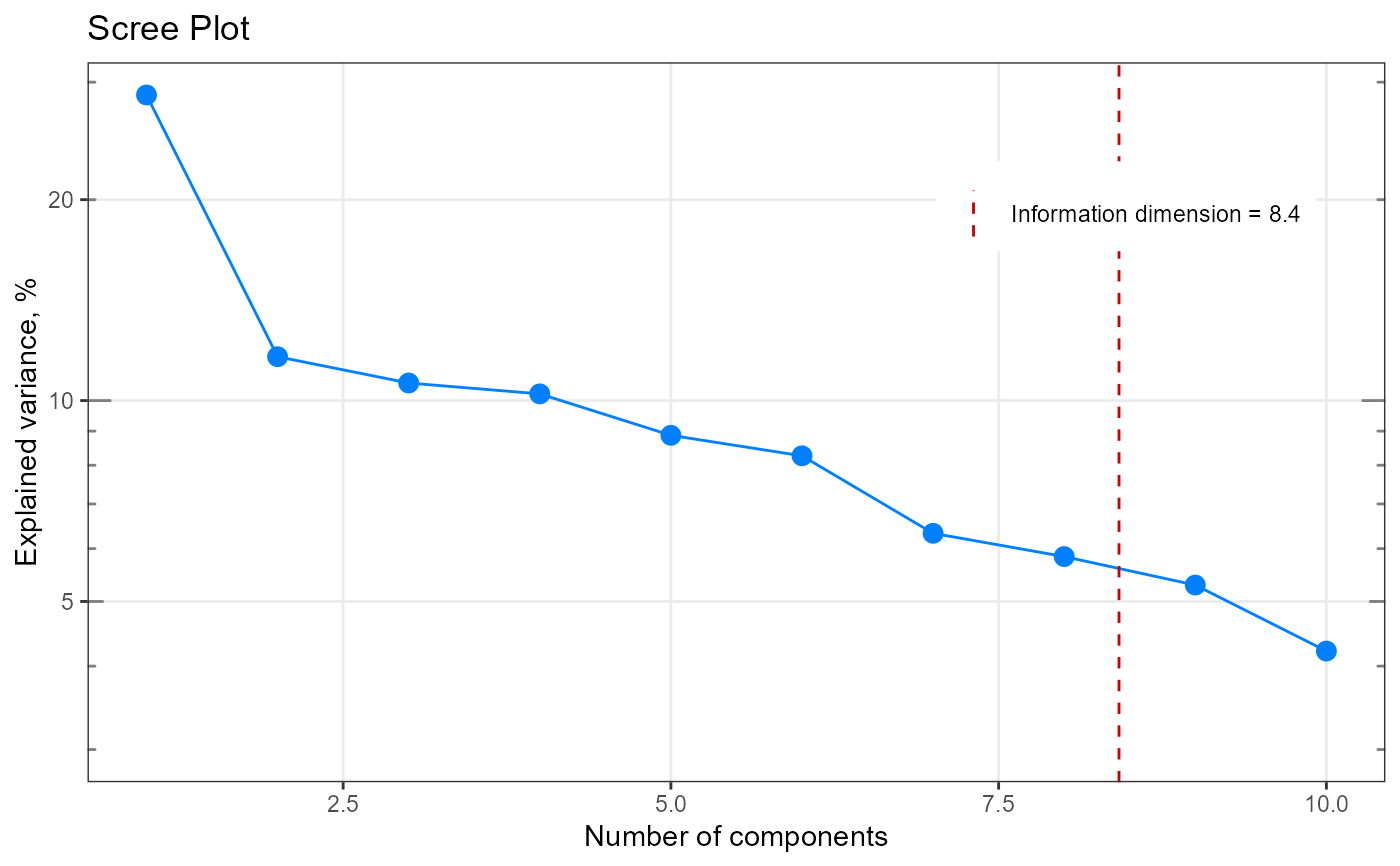
Information dimension (fractional, not rounded);
- $explained
A vector of eigenvalues, normalized by sum of eigenvalues, which can be used to determine the importance of (principal) components;
- $eigenvalues
A vector of eigenvalues;
- $n.comp
A vector with integers from 1 to length(eigenvalues).
References
[1] R. Cangelosi and A. Goriely, Component retention in principal component analysis with application to cDNA microarray data. Biol Direct, 2, 2 (2007), http://dx.doi.org/10.1186/1745-6150-2-2
See also
Other information dimension functions:
qplot_infoDim()
Other component analysis / factorisation related functions in spHelper:
getScores(),
plot_spDiff(),
qplot_infoDim(),
qplot_kAmp(),
qplot_kSp(),
qplot_spc(),
reconstructSp(),
sortLoadings(),
unipeak(),
whichOutlier()
Examples
 my_matrix <- matrix(rexp(200, rate=.1), ncol=20)

 my_result <- infoDim(my_matrix)

 # Investigate the result
 str(my_result)
#> List of 5
#>  $ dim        : num 9
#>  $ exactDim   : num 8.42
#>  $ explained  : num [1:10] 0.287 0.1163 0.1063 0.1023 0.0887 ...
#>  $ eigenvalues: num [1:10] 137.4 55.7 50.9 49 42.5 ...
#>  $ n.comp     : int [1:10] 1 2 3 4 5 6 7 8 9 10
#>  - attr(*, "class")= chr [1:2] "list" "infoDim"
 my_result$exactDim
#> [1] 8.418134
 my_result$dim
#> [1] 9

 #Plot
 my_plot <- qplot_infoDim(my_result)
 my_plot
