[!] Compare 2 spectroscopic signals
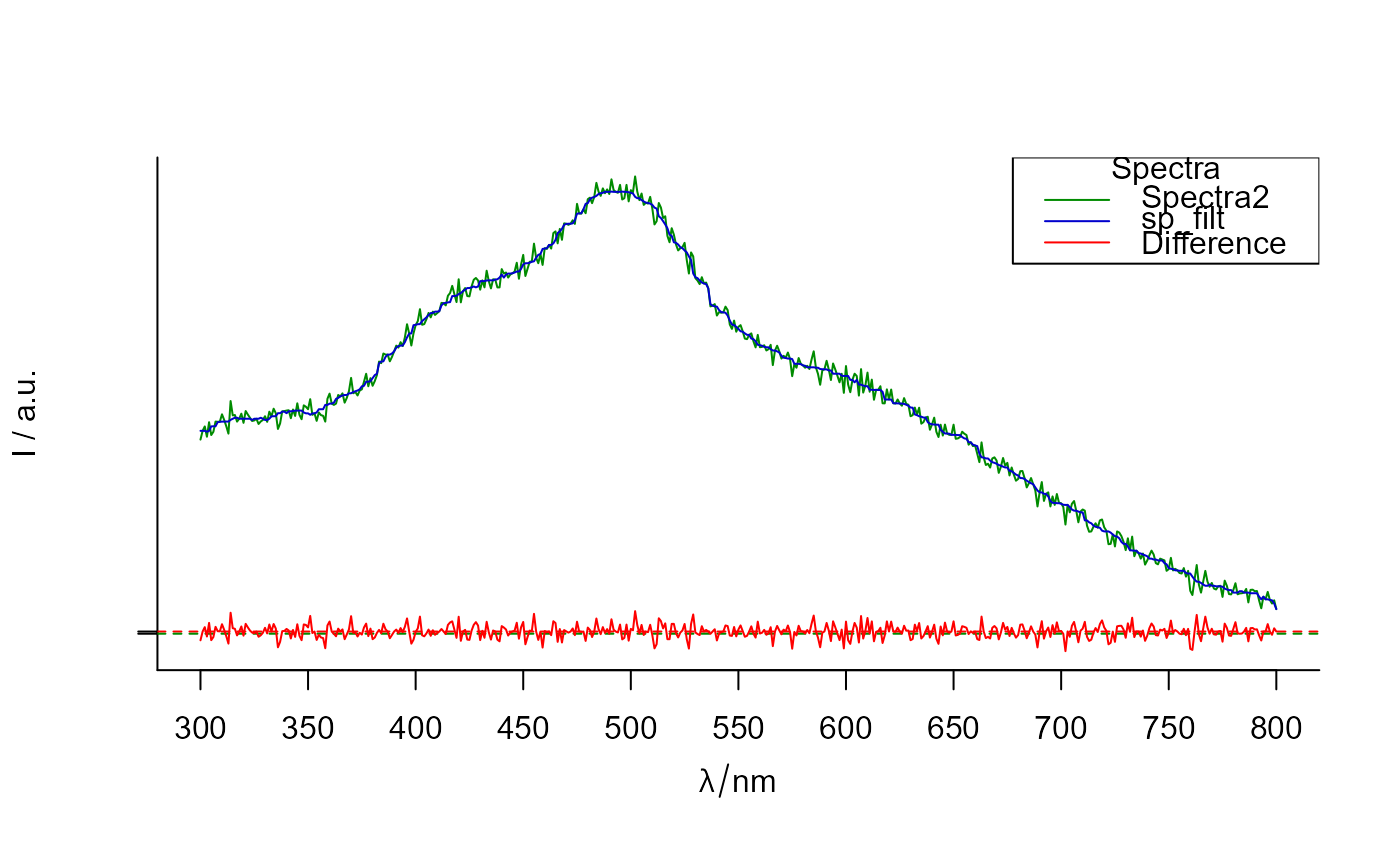
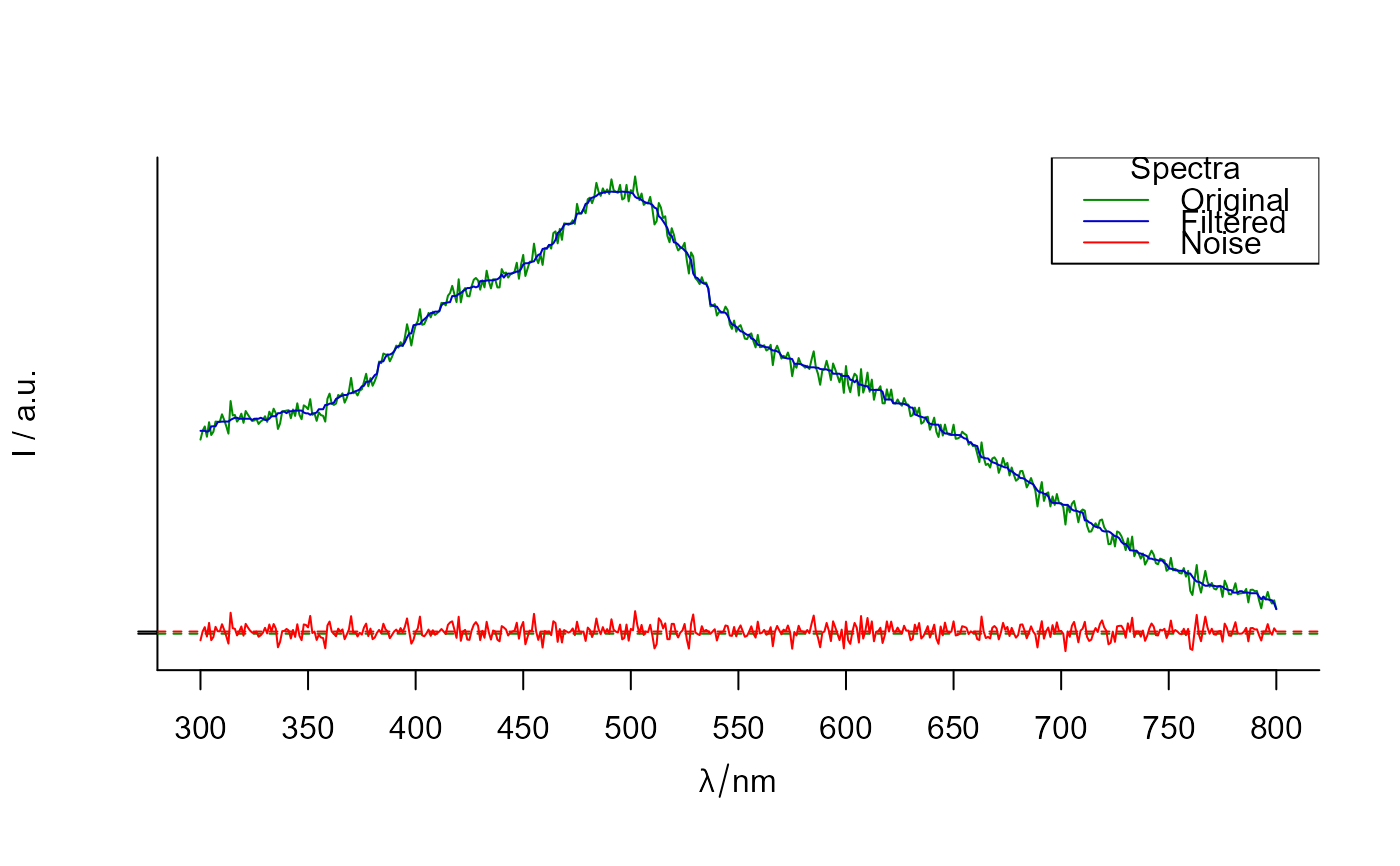
plot_spCompare.RdCompare 2 spectroscopic signals: plot 2 signals and their difference.
plot_spCompare(
  sp1,
  sp2,
  row = 1,
  colors = c("green4", "blue3", "red"),
  show.legend = TRUE,
  legend.title = "Spectra",
  legend.text = c(match.call()$sp1, match.call()$sp2, "Difference"),
  x = "topright",
  lwd = 1,
  ...
)
Arguments
- sp1, sp2
hyperSpec objects of the same size
- row
An integer, that indicates which row must be plotted.
- colors
Vector of 3 colors for original, filtered and noise signals respectively.
- show.legend
Logical
- legend.title
The title of the legend.
- legend.text
Character vertor of length = 3. The entries for the legend for for original, filtered and noise signals respectively.
- x, y
the x and y co-ordinates to be used to position the legend. They can be specified by keyword or in any way which is accepted by xy.coords: See 'Details' in
legend.- lwd
A line width. More details in par.
- ...
Other arguments to be passed to
legend(exceptlegend,title,colandlty).
Value
A plot made with R package graphics.
See also
Other spHelper plots:
check_palette(),
layer_spRangeMean(),
plot_colors(),
plot_hyPalette(),
plot_spDiff(),
plot_spDistribution(),
qplot_confusion(),
qplot_crosstab(),
qplot_infoDim(),
qplot_kAmp(),
qplot_kSp(),
qplot_prediction(),
qplot_spRangeCenter(),
qplot_spRangeMedian(),
qplot_spStat(),
qplot_spc(),
rmExpr(),
rm_stripes(),
stat_chull()
Examples
# Apply running medians filter:
sp_filt <- apply(Spectra2, 1, function(x) {runmed(x, 15)})

plot_spCompare(Spectra2, sp_filt, row = 2)
#> Warning: Function 'chk.hy' is deprecated.
#> Use function 'assert_hyperSpec' instead.
#> Warning: Function 'chk.hy' is deprecated.
#> Use function 'assert_hyperSpec' instead.
#> Warning: Function 'plotspc' is deprecated.
#> Use function 'plot_spc' instead.


# Modify the legend:
plot_spCompare(Spectra2, sp_filt, row = 2,legend.text  = c("Original","Filtered","Noise"))
#> Warning: Function 'chk.hy' is deprecated.
#> Use function 'assert_hyperSpec' instead.
#> Warning: Function 'chk.hy' is deprecated.
#> Use function 'assert_hyperSpec' instead.
#> Warning: Function 'plotspc' is deprecated.
#> Use function 'plot_spc' instead.
