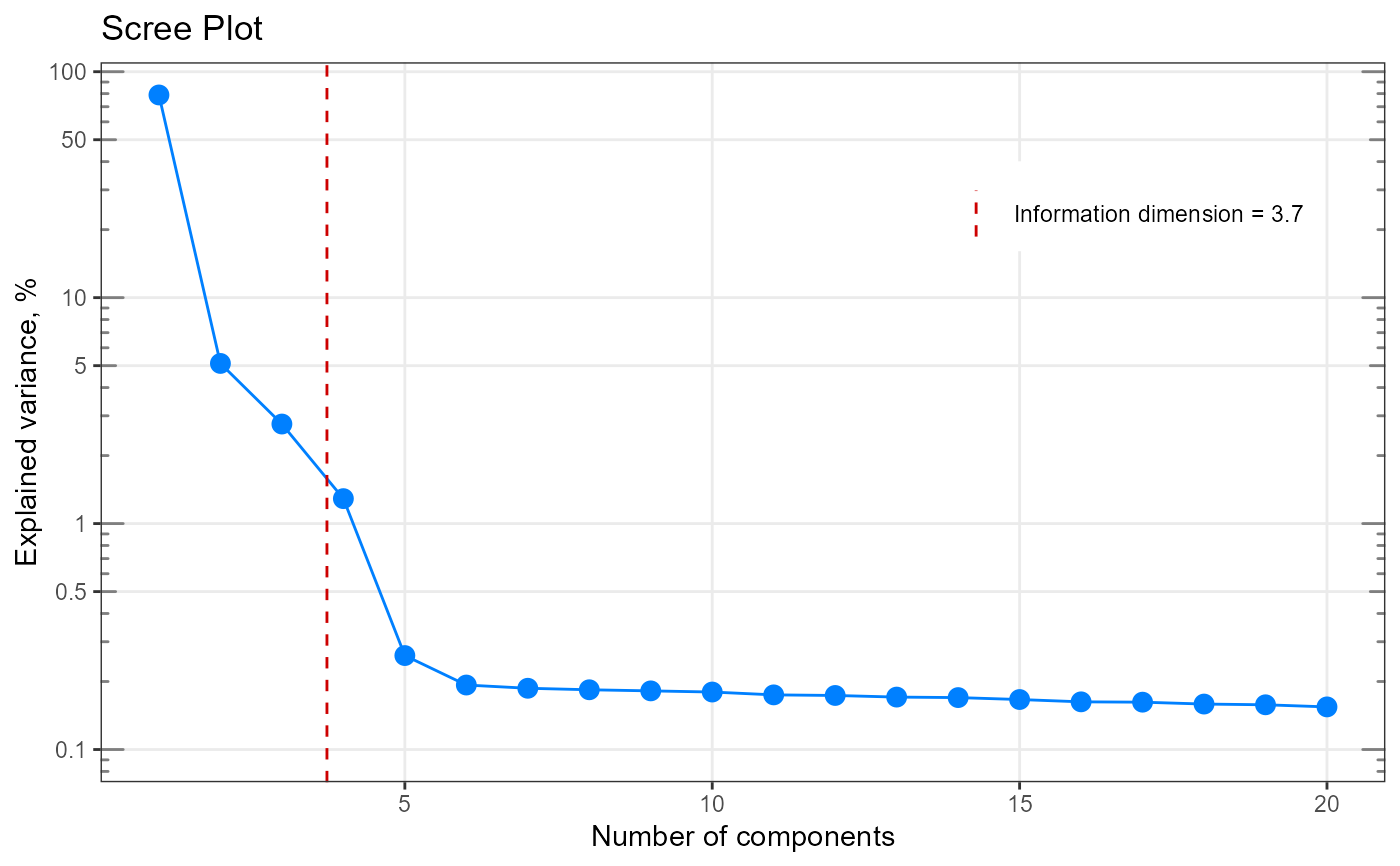
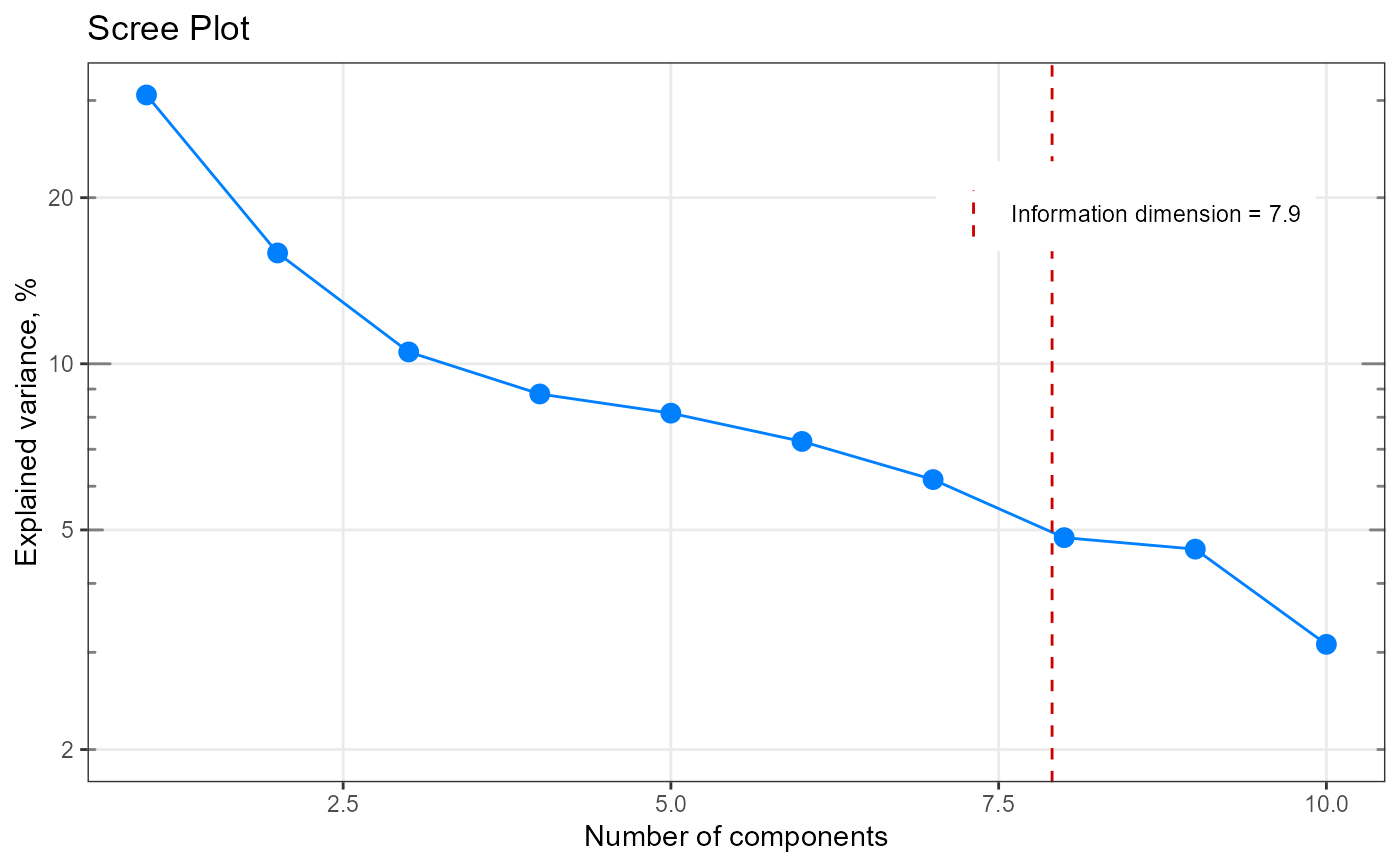
[+] Scree plot with indicated information dimension (ggplot2)
qplot_infoDim.RdPlot a screeplot and with indicated information dimension.
Arguments
- obj
Either a matrix (rows = observations, columns = variables; to be passed to
infoDim) or an obj (a list) generated by functioninfoDim.- n.comp.SHOW
A number of components to show on x axis, default is 20. This number is corrected if (a) vector of eigenvalues is smaller than 20 or (b) information dimension is higher than 15.
- selected
A number of components sellected, will be plotted as a separate vertical line (optional parameter).
- Title
The main title of the plot.
- y.log
Logical. If
TRUE(default) the scale of y axis is logarythmic.- show.legend
Logical. If
TRUE(default) the legend is displayed.- legend.position
the position of the legend ("none", "left", "right", "bottom", "top", or two-element numeric vector).
- ggtheme
A function of ggplot2 theme to apply (e.g.: ggtheme). Default is
theme_bw().- ...
(The same parameters as above).
Value
A scree plot : plot which helps to
determine the number of nenessary components (e.g. for PCA).
(A "ggplot" object.)
Note
http://www.originlab.com/doc
See also
Other spHelper plots:
check_palette(),
layer_spRangeMean(),
plot_colors(),
plot_hyPalette(),
plot_spCompare(),
plot_spDiff(),
plot_spDistribution(),
qplot_confusion(),
qplot_crosstab(),
qplot_kAmp(),
qplot_kSp(),
qplot_prediction(),
qplot_spRangeCenter(),
qplot_spRangeMedian(),
qplot_spStat(),
qplot_spc(),
rmExpr(),
rm_stripes(),
stat_chull()
Other component analysis / factorisation related functions in spHelper:
getScores(),
infoDim(),
plot_spDiff(),
qplot_kAmp(),
qplot_kSp(),
qplot_spc(),
reconstructSp(),
sortLoadings(),
unipeak(),
whichOutlier()
Other information dimension functions:
infoDim()
Examples
 data(Spectra2, package ="spHelper")
 qplot_infoDim(Spectra2)


# ------------------------------------------------------
 my_matrix <- matrix(rexp(200, rate=.1), ncol=20)
 my_result <- infoDim(my_matrix)

 # Investigate the result
 str(my_result)
#> List of 5
#>  $ dim        : num 8
#>  $ exactDim   : num 7.91
#>  $ explained  : num [1:10] 0.307 0.1588 0.1051 0.0882 0.0814 ...
#>  $ eigenvalues: num [1:10] 162.7 84.2 55.7 46.7 43.1 ...
#>  $ n.comp     : int [1:10] 1 2 3 4 5 6 7 8 9 10
#>  - attr(*, "class")= chr [1:2] "list" "infoDim"
 my_result$exactDim
#> [1] 7.907656
 my_result$dim
#> [1] 8

 #Plot
 my_plot <- qplot_infoDim(my_result)
 my_plot


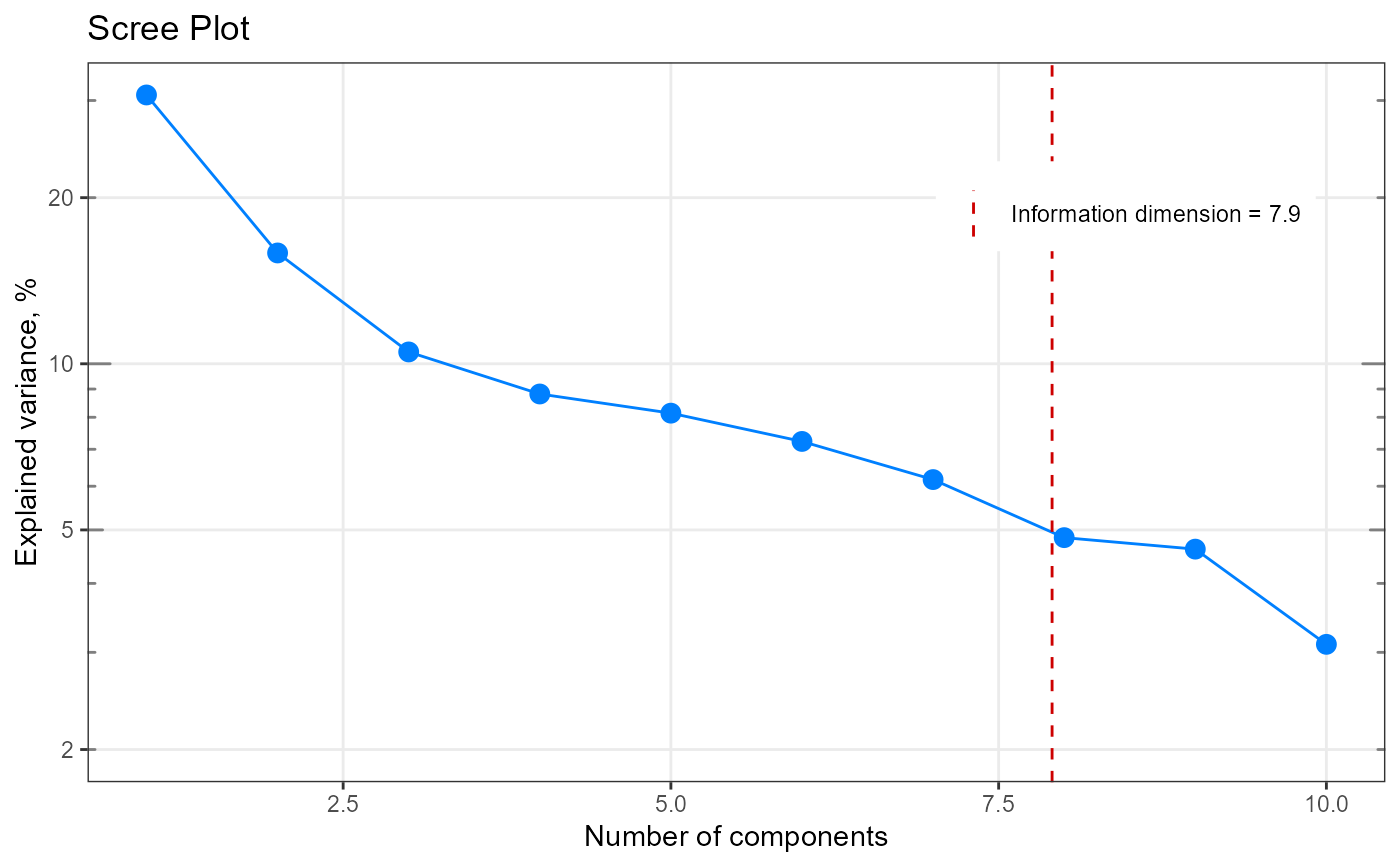
qplot_infoDim(my_matrix)
