[!] Plot Median and range of spectroscopic data intensities
qplot_spRangeMedian.RdPlot range of y axis values (usually intensities) of spectroscopic data
between selected percentilles.
Function qplot_spRange() returns whole ggplot and
function layer_spRange() returns a layer which can be added to a ggplot.
qplot_spRangeMedian(
  sp,
  by = NULL,
  percent = NULL,
  probs = NULL,
  palette = hyGet_palette(sp),
  ...,
  lwd_median = 1,
  legend_title = by,
  alpha = 0.2,
  add = FALSE,
  name_if_by_is_NULL = "All Data"
)
Arguments
- sp
hyperSpecobject.- by
A vector (factor variable) with indicated groups for each case: either variable name inside the object
sp, or a vector of lengthnrow(sp).- percent
Numeric value between 0 and 100 that indicates percentage of samples nearest to median be plotted as a ribbon.
- probs
verctor of size 2 with values between 0 and 1 that indicates probabilities at which percentiles should be plotted.
- ...
further arguments to
geom_ribon.- legend_title
(character|NULL) The title for legend.
- alpha
(numeric from 0 to 1) transperency.
- add
(logical) add plot to an existing ggplot object?
Value
A ggplot object.
More details in package ggplot2.
See also
Other spHelper plots:
check_palette(),
layer_spRangeMean(),
plot_colors(),
plot_hyPalette(),
plot_spCompare(),
plot_spDiff(),
plot_spDistribution(),
qplot_confusion(),
qplot_crosstab(),
qplot_infoDim(),
qplot_kAmp(),
qplot_kSp(),
qplot_prediction(),
qplot_spRangeCenter(),
qplot_spStat(),
qplot_spc(),
rmExpr(),
rm_stripes(),
stat_chull()
Examples
library(spHelper)
library(spPlot)
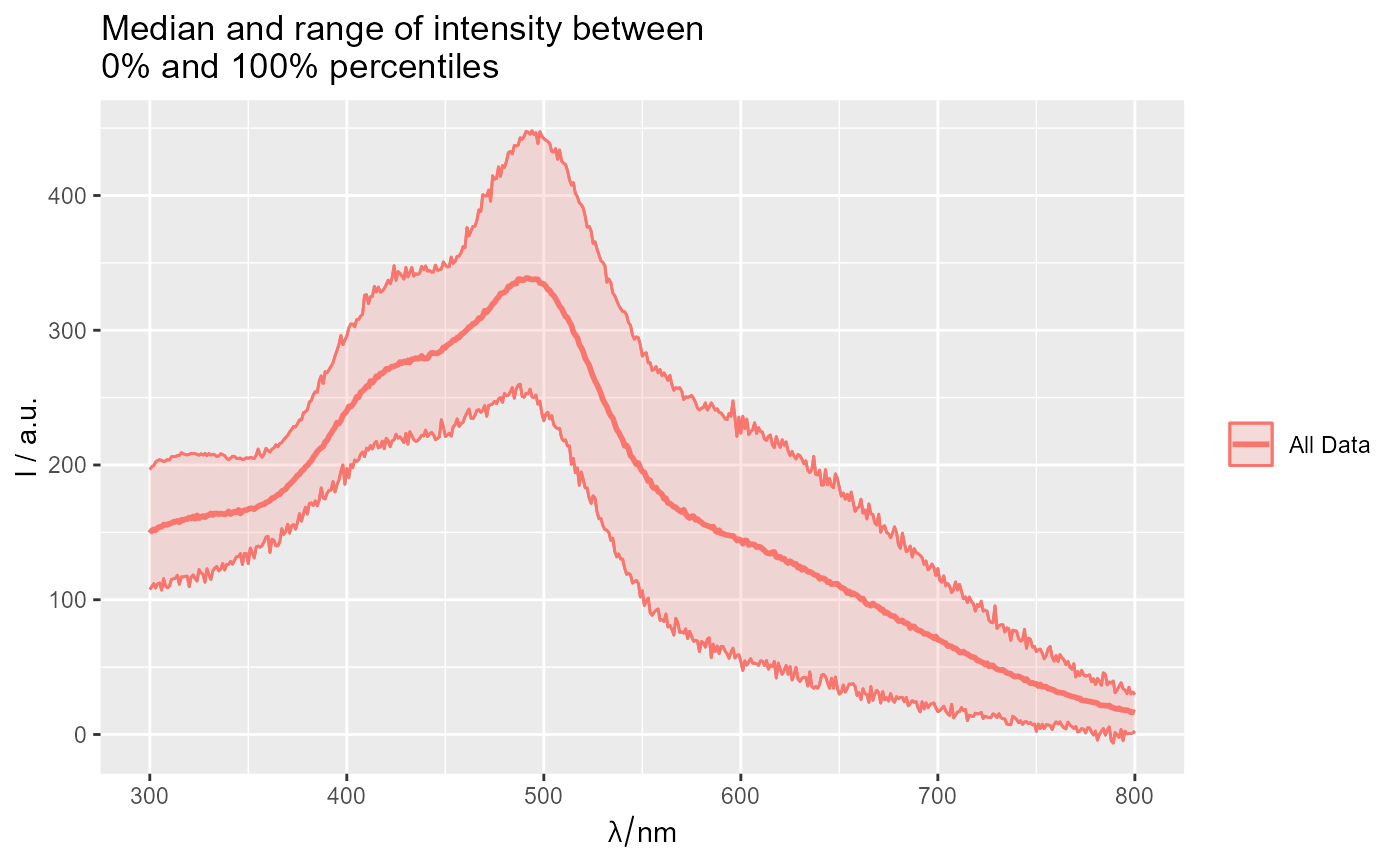
qplot_spRangeMedian(Spectra2)
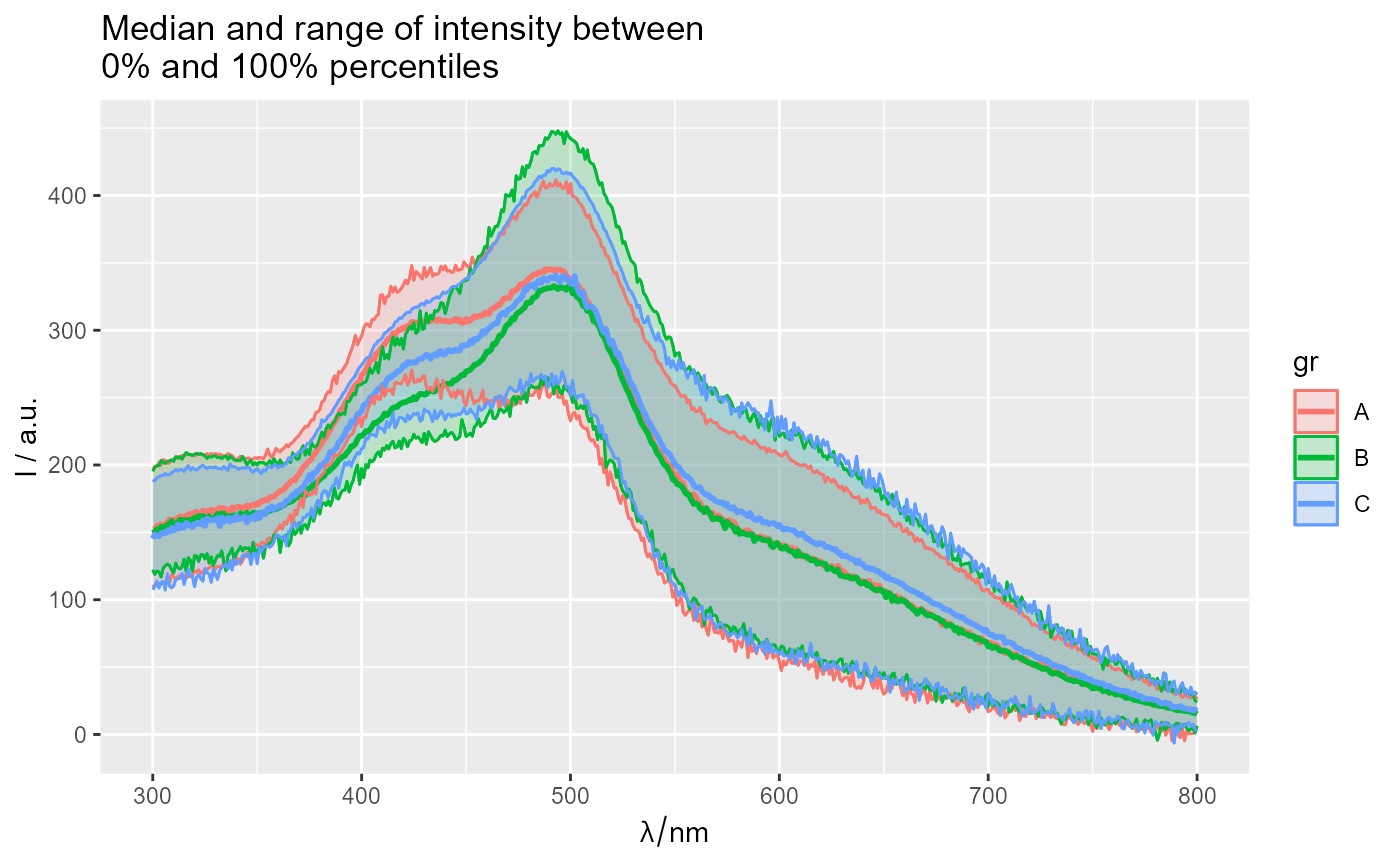
 qplot_spRangeMedian(Spectra2, "gr")
 # Both lines below gives identical plots with different default titles:
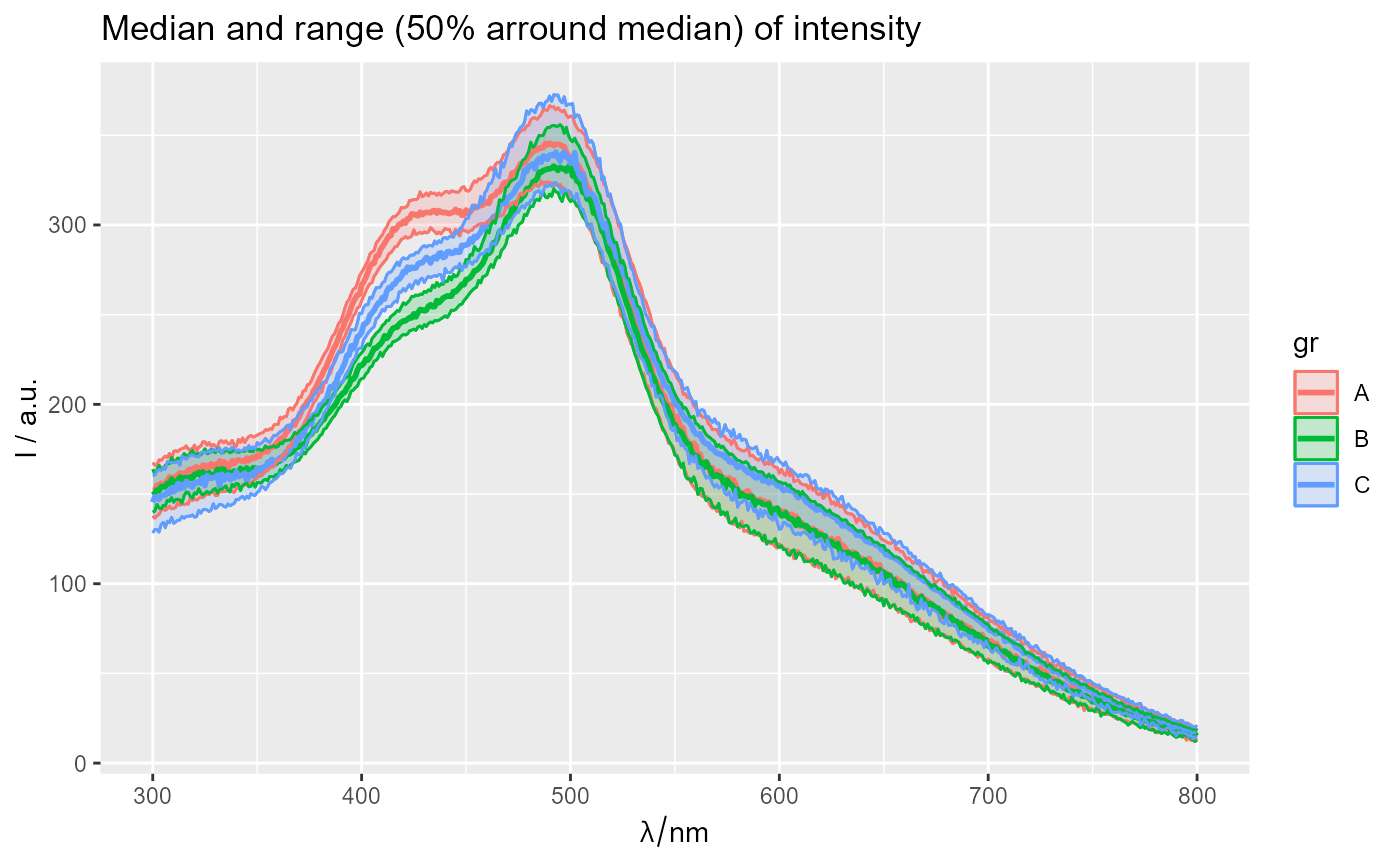
qplot_spRangeMedian(Spectra2, "gr", percent = 50)
# Both lines below gives identical plots with different default titles:
qplot_spRangeMedian(Spectra2, "gr", percent = 50)
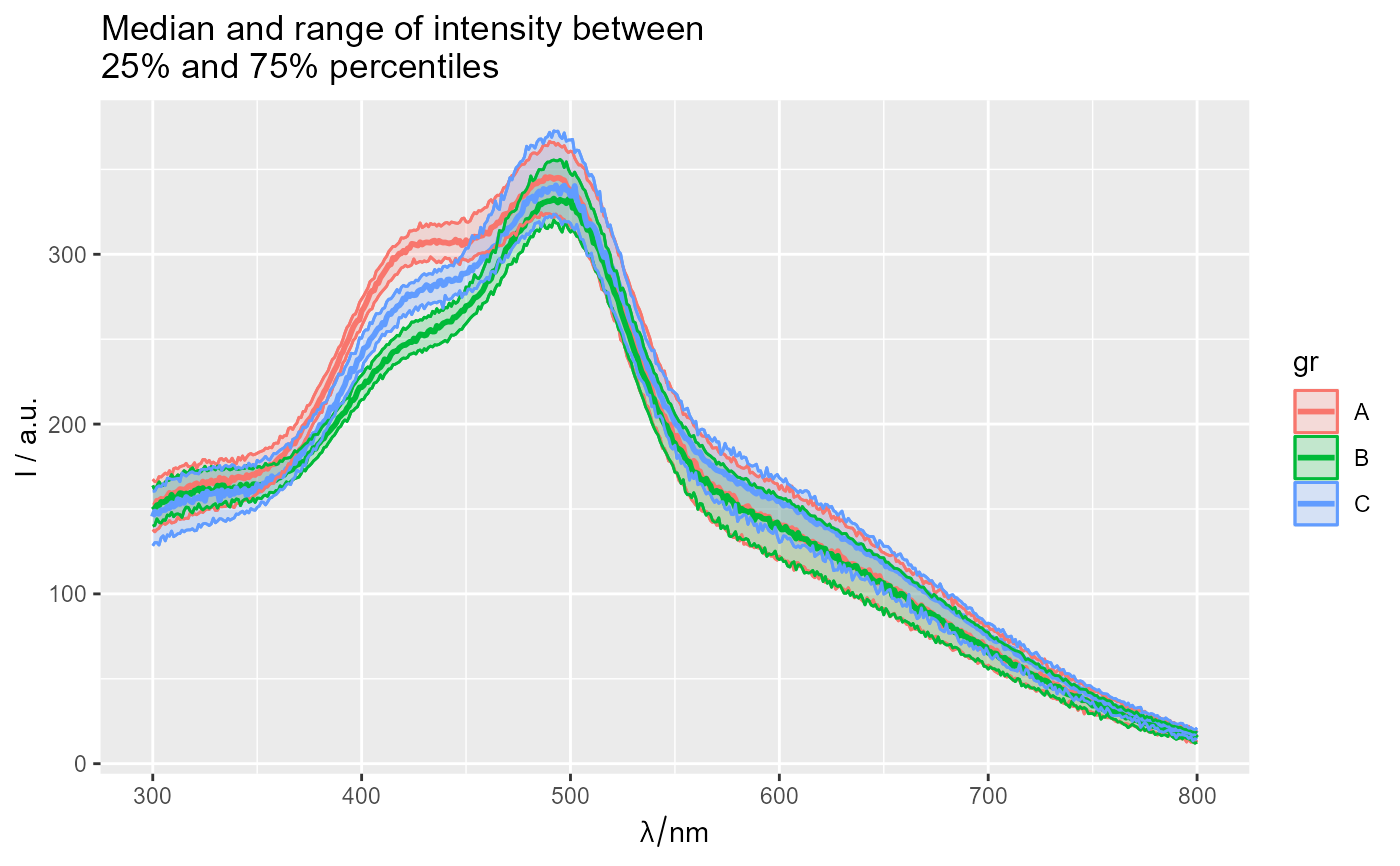
 qplot_spRangeMedian(Spectra2, "gr", probs = c(.25, .75))
 ggplotly_tidy()
#> Error in simsalapar::expr2latex(expr): is not language nor symbol), but length(.) = 4 != 1
ggplotly_tidy()
#> Error in simsalapar::expr2latex(expr): is not language nor symbol), but length(.) = 4 != 1