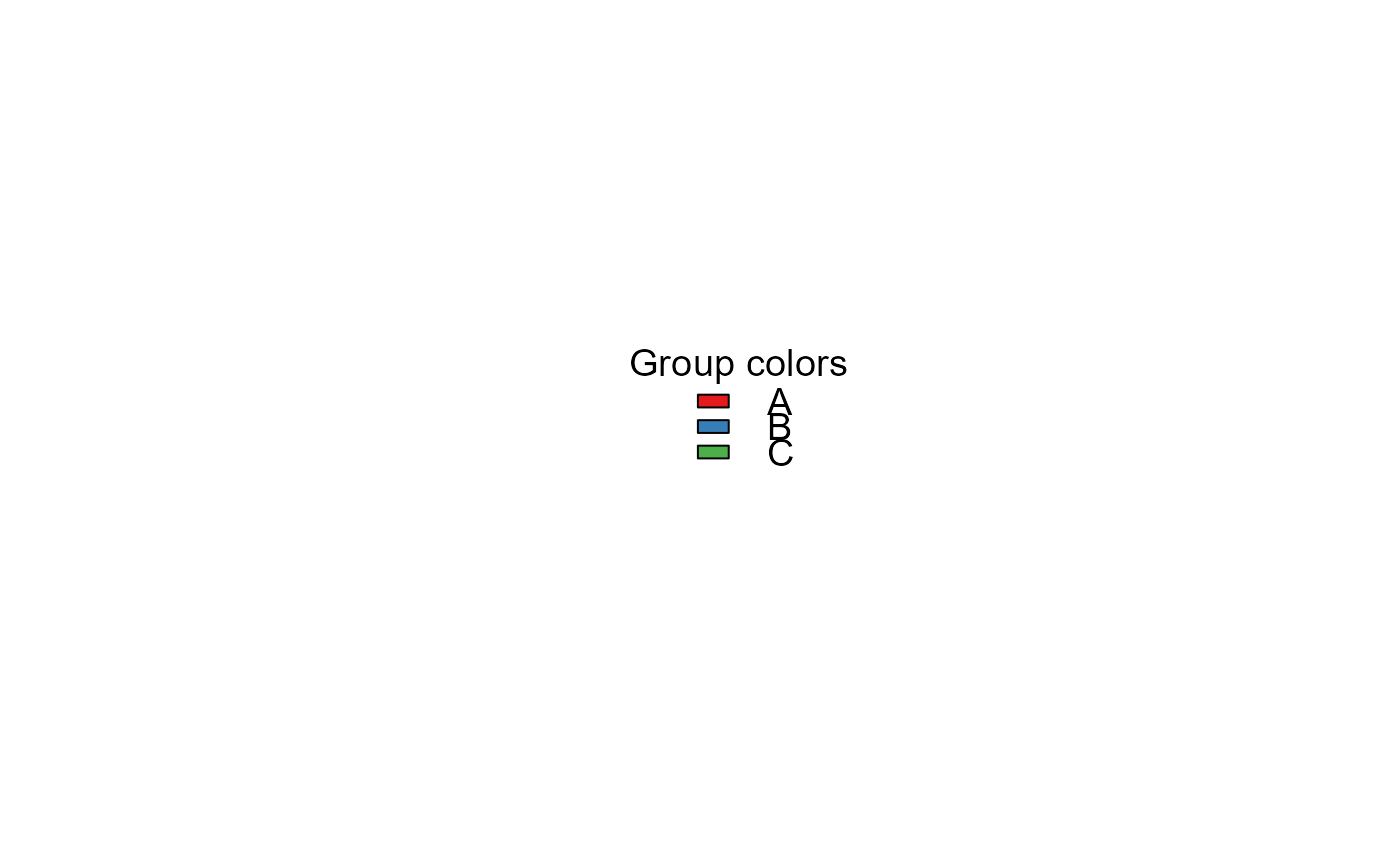
[!] Plot the color palette used in a hyperSpec object
plot_hyPalette.RdPlot a color palette in a hyperSpec object,
which was added with function hyAdd_color.
plot_hyPalette(
  sp = NULL,
  by = ".color",
  palette = hyGet_palette(sp),
  cex = if (as.legend == FALSE) 1.2 else 1,
  Title = if (!is.null(sp)) "Group colors" else "Colors",
  as.legend = FALSE,
  xpd = NA,
  x = "topright",
  y = NULL,
  bty = "n",
  ...
)
Arguments
- sp
hyperSpecobject.- by
Either a name of factor variale in
spwhich levels correspond to colors inpaletteor, ifspis not present, a charter vector of names to be ploted as a text.- palette
A list of color names or color codes.
- cex
character expansion factor relative to current
par("cex"). Used for text, and provides the default forpt.cex.- Title
The title.
- as.legend
Logical. If
TRUE, the result is used as legend for existing R base graphics plot. IfFALSE(default), a separate plot is drawn.- xpd
A logical value or
NA. IfFALSE, all plotting is clipped to the plot region, ifTRUE, all plotting is clipped to the figure region, and ifNA, all plotting is clipped to the device region. See alsoclip.- x, y
the x and y co-ordinates to be used to position the legend. They can be specified by keyword or in any way which is accepted by xy.coords: See "Details" in
legend.- bty
The type of box to be drawn around the legend. The allowed values are "o" and "n" (the default).
- ...
Other arguments to be passed to
legend. (exceptlegend,titleandfill)
Value
A plot made with R package graphics.
See also
Other spHelper plots:
check_palette(),
layer_spRangeMean(),
plot_colors(),
plot_spCompare(),
plot_spDiff(),
plot_spDistribution(),
qplot_confusion(),
qplot_crosstab(),
qplot_infoDim(),
qplot_kAmp(),
qplot_kSp(),
qplot_prediction(),
qplot_spRangeCenter(),
qplot_spRangeMedian(),
qplot_spStat(),
qplot_spc(),
rmExpr(),
rm_stripes(),
stat_chull()
Other spHelper functions for spectroscopy and hyperSpec:
IQR_outliers(),
binning(),
file,
gapDer(),
hy2mat(),
hyAdd_Label_wl(),
hyAdd_Labels_PAP_PD_2014(),
hyAdd_Labels_TD2009(),
hyAdd(),
hyDrop_NA(),
hyGet_palette(),
hyRm_palette(),
mad_outliers(),
mean_Nsd(),
median_Nmad(),
prepare_PAP_RK_2014__MATLAB_failui(),
read.OOIBase32(),
read.OceanView.header(),
read.OceanView(),
read.sp.csv2(),
read3csv2hy(),
replace_spc(),
sd_outliers(),
spStat(),
sp_class_perform()
Examples
# Example 1
sp <- hyAdd_color(Spectra3,"gr")
plot_hyPalette(sp, "gr")
#> Warning: Function 'chk.hy' is deprecated.
#> Use function 'assert_hyperSpec' instead.


#-----------------------------------------------------
# Example 2
plot_hyPalette(by = "RED color", palette = "#ee0000")


#-----------------------------------------------------
# Example 3
# Use data 'sp' from example 1
# The legend does not make sense in this context. It's just an example.

plot(flu)
plot_hyPalette(sp, "gr", as.legend = TRUE, cex = 1)
#> Warning: Function 'chk.hy' is deprecated.
#> Use function 'assert_hyperSpec' instead.
