[!] Distribution of spectroscopoc data as percentiles
plot_spDistribution.Rd[!] Distribution of spectroscopoc data as percentiles
plot_spDistribution(
  sp,
  position.legend = "topright",
  show.legend = TRUE,
  cex.legend = 1,
  ...
)
Arguments
Value
a plot
See also
Other spHelper plots:
check_palette(),
layer_spRangeMean(),
plot_colors(),
plot_hyPalette(),
plot_spCompare(),
plot_spDiff(),
qplot_confusion(),
qplot_crosstab(),
qplot_infoDim(),
qplot_kAmp(),
qplot_kSp(),
qplot_prediction(),
qplot_spRangeCenter(),
qplot_spRangeMedian(),
qplot_spStat(),
qplot_spc(),
rmExpr(),
rm_stripes(),
stat_chull()
Examples
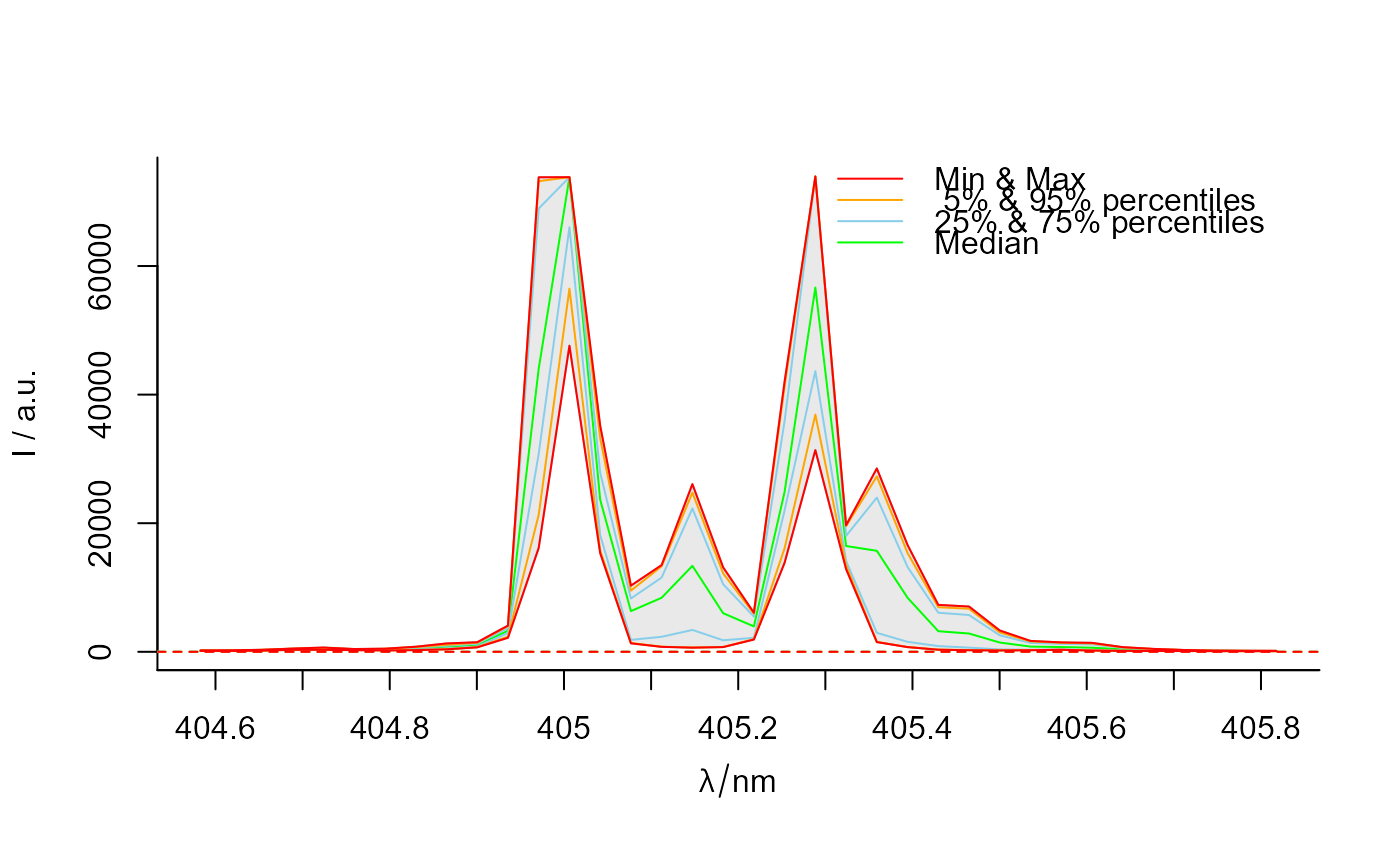
plot_spDistribution(laser)
#> Warning: Function 'plotspc' is deprecated.
#> Use function 'plot_spc' instead.
#> Warning: Function 'plotspc' is deprecated.
#> Use function 'plot_spc' instead.
#> Warning: Function 'plotspc' is deprecated.
#> Use function 'plot_spc' instead.
#> Warning: Function 'plotspc' is deprecated.
#> Use function 'plot_spc' instead.
#> Warning: Function 'plotspc' is deprecated.
#> Use function 'plot_spc' instead.

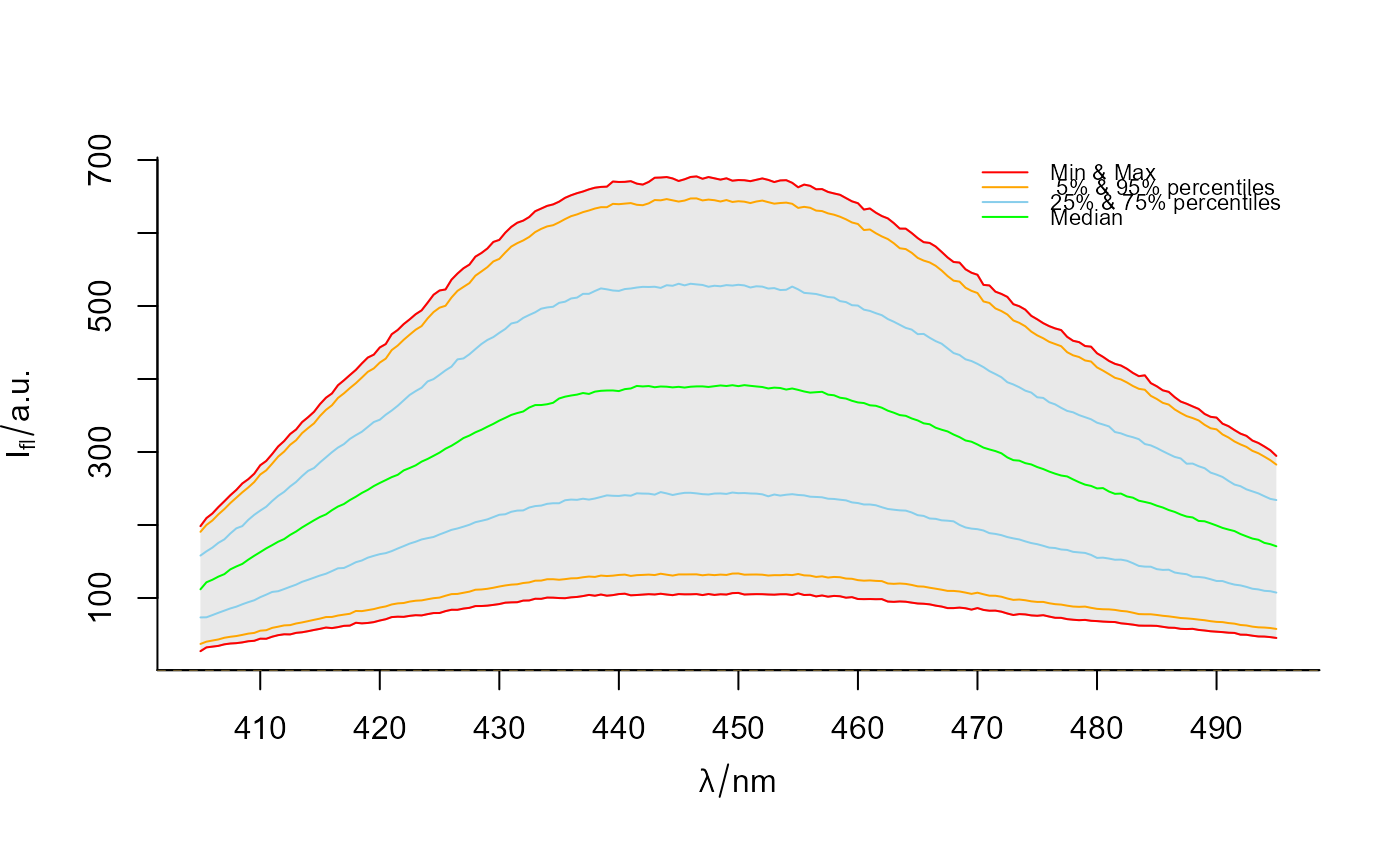
plot_spDistribution(flu, cex.legend = .7)
#> Warning: Function 'plotspc' is deprecated.
#> Use function 'plot_spc' instead.
#> Warning: Function 'plotspc' is deprecated.
#> Use function 'plot_spc' instead.
#> Warning: Function 'plotspc' is deprecated.
#> Use function 'plot_spc' instead.
#> Warning: Function 'plotspc' is deprecated.
#> Use function 'plot_spc' instead.
#> Warning: Function 'plotspc' is deprecated.
#> Use function 'plot_spc' instead.
