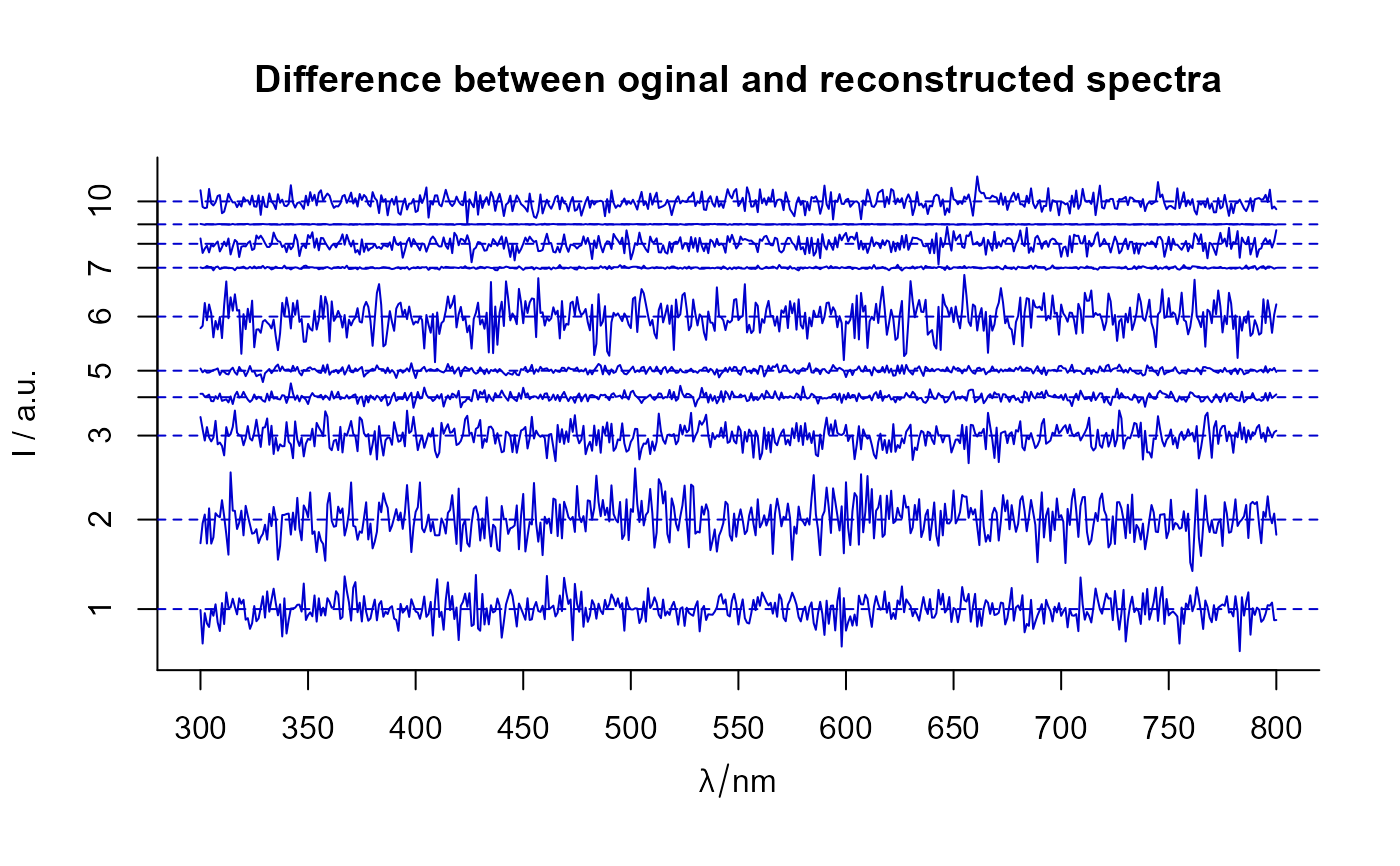
[+] Plot difference between original and reconstructed spectra
plot_spDiff.RdPlot difference between original (e.g., experimental) and
reconstructed spectra. Function reconstructSp is used
to reconstruct spectra, that are subtracted from original spectra afrterwards.
Arguments
- loadings
Components' spectra (loadings) as a
hyperSpecobject.- scores
Components' amplitudes (scores) as either a matrix or a
hyperSpecobject.- sp
hyperSpecobject.- Title
The main title for the plot.
- color
see
par col. Might be a vector giving individual colors for the spectra. Default values: vector insp$.color, if does not exist, "tan3" is used as a default color.- stacked
if not
NULL, a "stacked" plot is produced.stackedmay beTRUEto stack single spectra. A numeric or factor is be interpreted as giving the grouping, character is interpreted as the name of the extra data column that holds the groups. Default stacking is bysp$ID, andNULLif this variable is missing.- ...
Other parameters to be passed to function
plotspc.
Value
A plot of calculated difference between expected (original) and reconstructed spectra. (Drawn with R package graphics).
Note
Function plotspc is used to make a plot. R base
plotting system annotations can be used to enhance the plot.
See also
Other spHelper plots:
check_palette(),
layer_spRangeMean(),
plot_colors(),
plot_hyPalette(),
plot_spCompare(),
plot_spDistribution(),
qplot_confusion(),
qplot_crosstab(),
qplot_infoDim(),
qplot_kAmp(),
qplot_kSp(),
qplot_prediction(),
qplot_spRangeCenter(),
qplot_spRangeMedian(),
qplot_spStat(),
qplot_spc(),
rmExpr(),
rm_stripes(),
stat_chull()
Other component analysis / factorisation related functions in spHelper:
getScores(),
infoDim(),
qplot_infoDim(),
qplot_kAmp(),
qplot_kSp(),
qplot_spc(),
reconstructSp(),
sortLoadings(),
unipeak(),
whichOutlier()
Examples
plot_spDiff(Loadings2, Scores2[1:10,,], Spectra2[1:10,,], stacked = TRUE)
#> Warning: Function 'plotspc' is deprecated.
#> Use function 'plot_spc' instead.