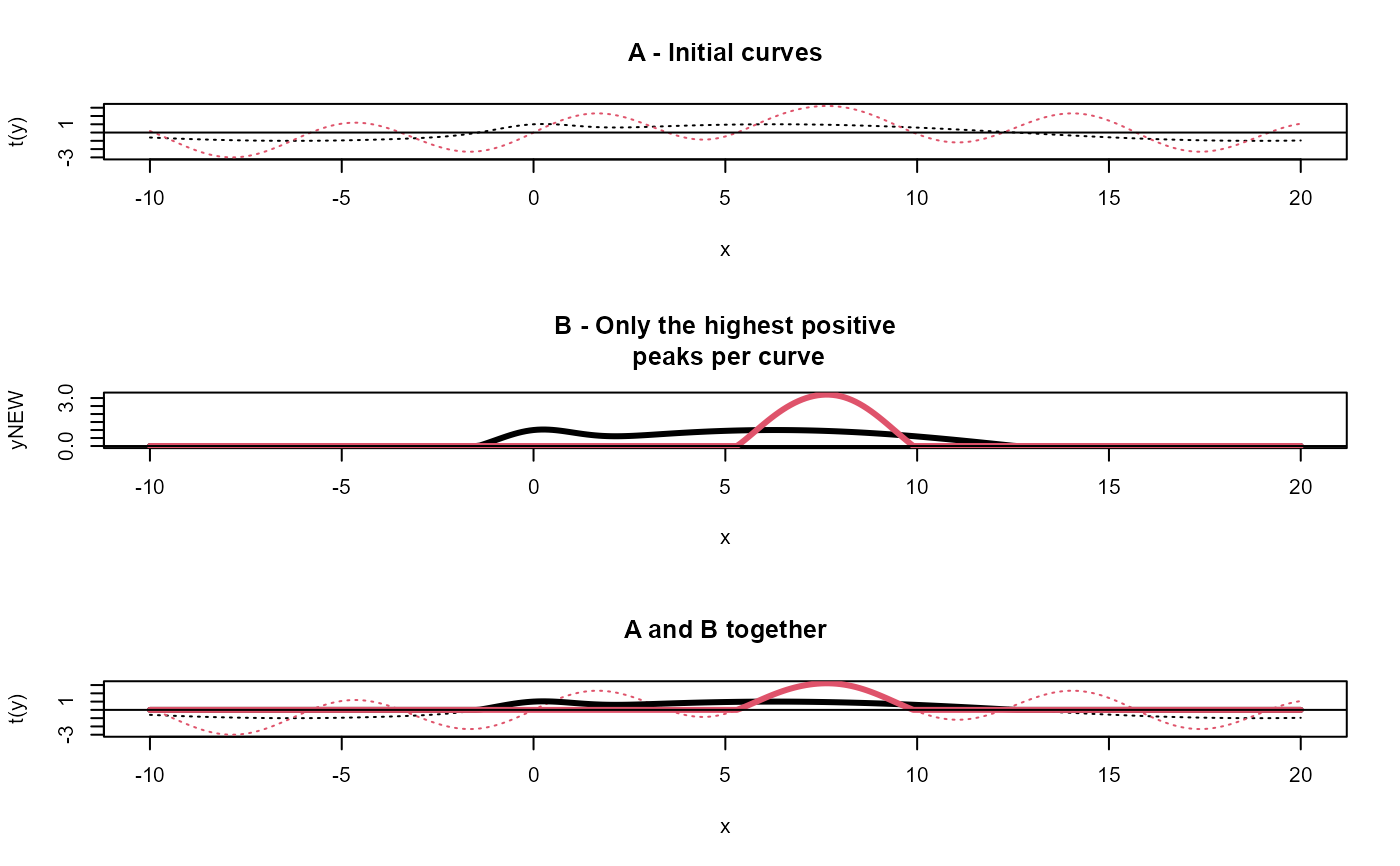
[+] Find and keep only the highest positive part of a curve
unipeak.RdRemove negative parts of a curve then find the highest positive
part one and, lastly, remove all the remaining smaller ones.
Can be used to treat loadings of principal componenst before
using them as initial conditions for MCR-ALS algorythm (e.g.
als, doALS).
unipeak(y)Arguments
- y
A vector that represents a curve.
Value
Modified y
See also
Other curves inspHelper:
GaussAmp()
Other component analysis / factorisation related functions in spHelper:
getScores(),
infoDim(),
plot_spDiff(),
qplot_infoDim(),
qplot_kAmp(),
qplot_kSp(),
qplot_spc(),
reconstructSp(),
sortLoadings(),
whichOutlier()
Examples
#  Example 1 ------------------------------------------------------------------------

x     <- seq(-10,20,.1)
y0    <- sin(x)/3 + GaussAmp(x,c = 7, A = 1.5) -.1
y0NEW <- unipeak(y0)

# Plot the results
par(mfrow = c(1,1))
plot( x, y0,    type = "l", lty = 3,
        main = "'unipeak' keeps positive part \n of highest peak only" );
lines(x, y0NEW, type = "l", lty = 1, lwd = 3);
legend("topleft", legend = c("Before","After"), lty = c(3,1))


#  Example 2 ------------------------------------------------------------------------

x  <- seq(-10,20,.1)
y1 <- (sin(x/4) + GaussAmp(x))
y2 <- (2*sin(x) + sin(x/5) + GaussAmp(x, c = 6))
y  <- base::rbind(y1,y2)

yNEW <- apply(y,1,unipeak)

op <- par(mfrow = c(3,1))

# plot 1
matplot(x, t(y), type = "l", lty = 3,  main = "A - Initial curves");
abline(h = 0)

# plot 2
matplot(x,yNEW, type = "l", lty = 1,lwd = 3,
        main = "B - Only the highest positive\n peaks per curve");
abline(h = 0)

# plot 3: both plots together
matplot(x, t(y), type = "l", lty = 3, main = "A and B together");
matlines(x,yNEW, type = "l", lty = 1,lwd = 3);
abline(h = 0)


par(op)