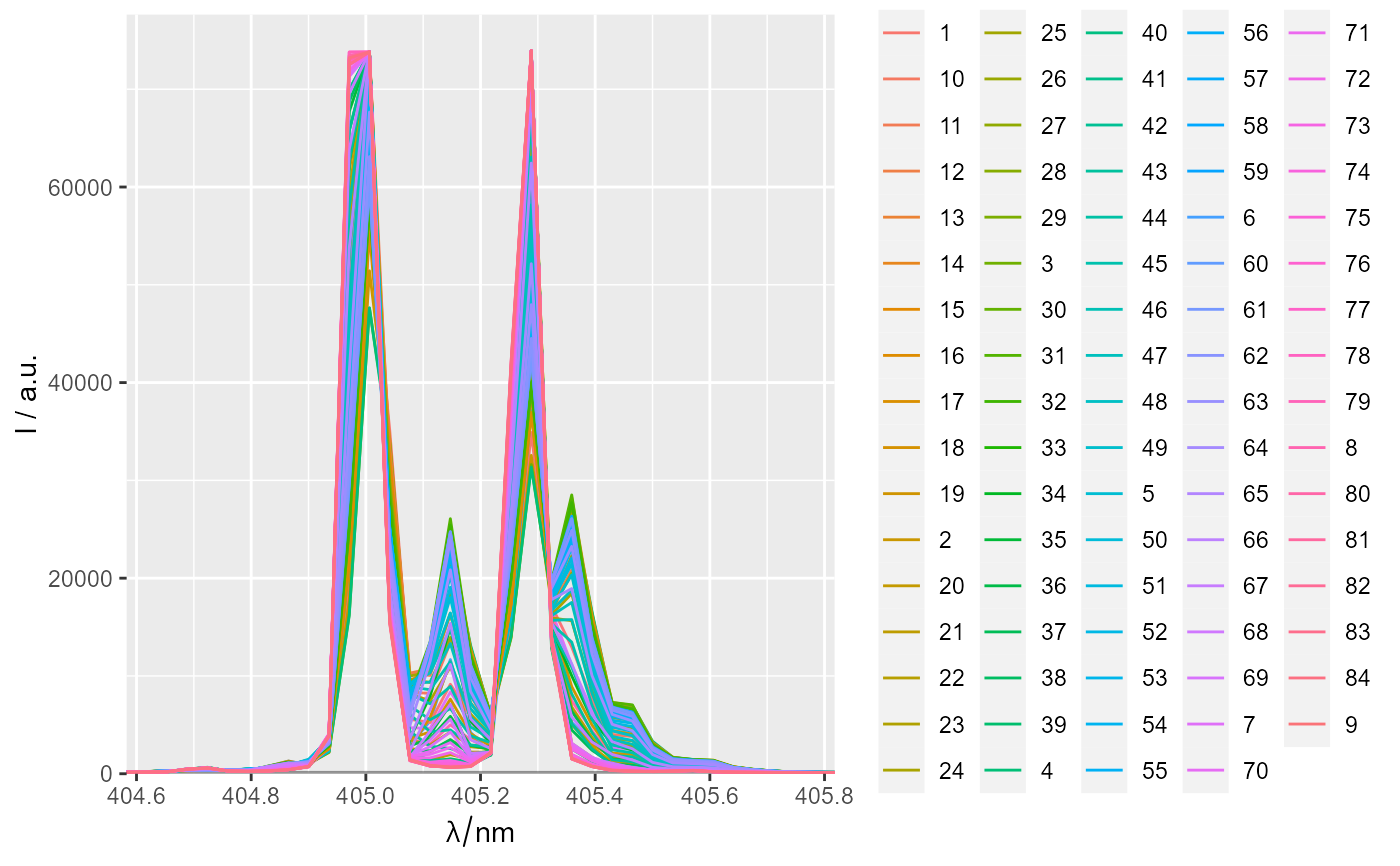
[!+] Plot spectroscopic curves and spectral components (a.k.a. loadings)
qplot_kSp.RdPlot spectroscopic curves in different colors.
Functions qplot_kSp, qplot_kSpFacets are designed
to plot spectra of spectral components
(a.k.a. loadings), extracted in principal component analysis
(e.g., princomp), variaus matrix factorization
methods (e.g., nmf)) and some other dimension
reduction methods.
The function qplot_sp is convenient for all spectroscopic
curves as uses no fill.
qplot_kSp(
  loadings,
  Title = "Components",
  xLabel = labels(loadings, ".wavelength"),
  yLabel = labels(loadings, "spc"),
  by = "cNames",
  palette = hyGet_palette(loadings),
  legendName = FALSE,
  filled = TRUE,
  normalize = FALSE,
  facets = FALSE,
  subTitle = NULL,
  names.in = NULL,
  line_size = 1
)

qplot_kSpFacets(
  ...,
  Title = "Components (stacked)",
  normalize = "auto",
  facets = TRUE
)

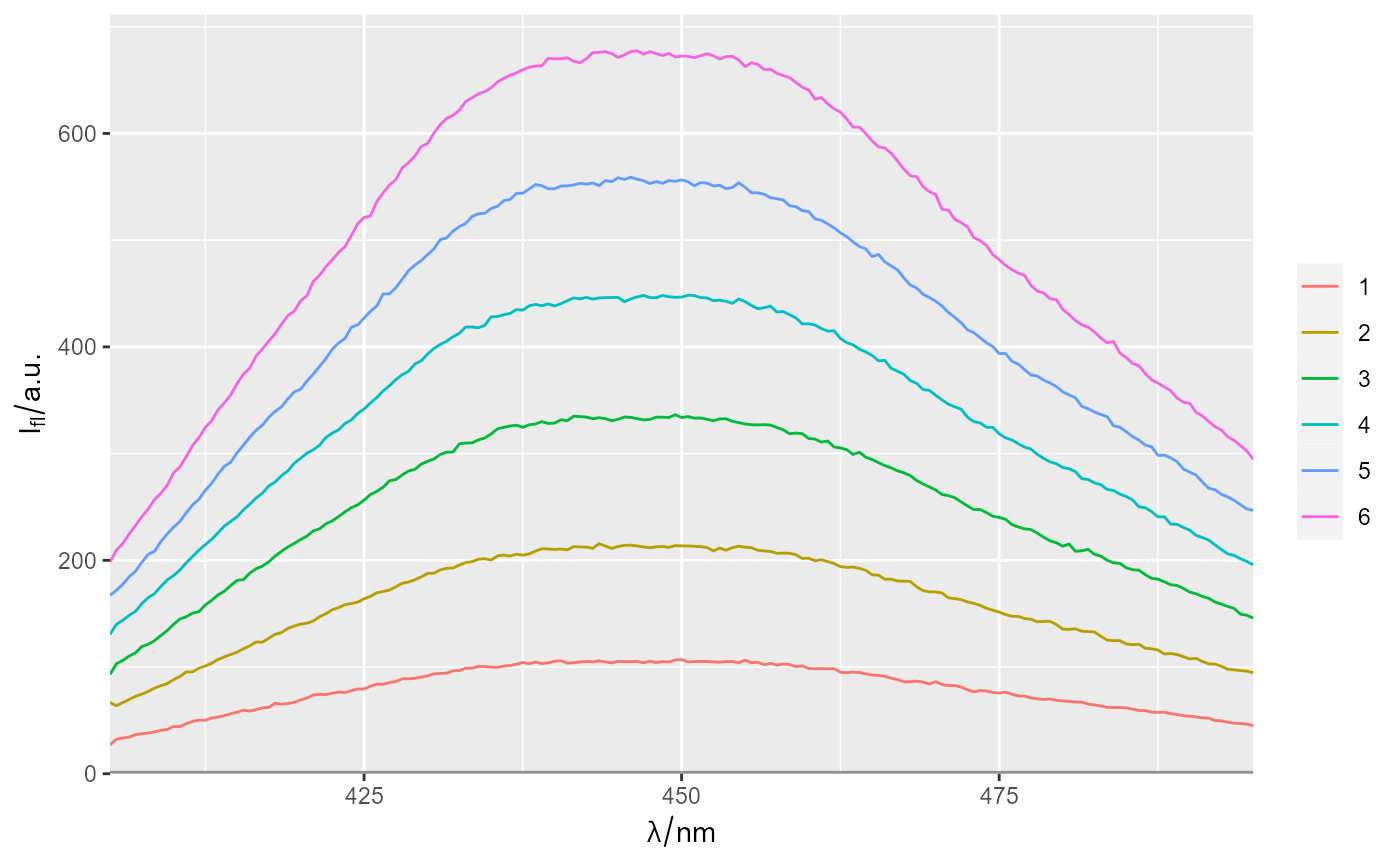
qplot_sp(..., Title = NULL, filled = FALSE, line_size = 0.5)
Arguments
- loadings
Components' spectra (loadings) as a
hyperSpecobject.- Title
The main title for the plot.
- xLabel
A label for abscisa (x) axis.
- yLabel
A label for ordinate (y) axis.
- by
A name of variable in
loadingsthat contains variable names. If indicated variable does not exist, row names are used instead.
Default isnames = 'cNames'- legendName
A name of a legend. Possible entries:
logical
FALSE- a legend without a name;logical
TRUE- a label of a variablenameis used as a name of a legend (legendName <- labels(loadings,name));...manual input of the name.
- filled
Logical. If
TRUE, colored fill is used. IfFALSE, no fill is used. (Fill is an area between ordinate axis and the curve.)- normalize
A flag that indicates whether components should be normalized before plotting. Possible selections:
FALSE,0- do not normalize;TRUE,+1- normalize to max value;-TRUE,-1- normalize to min value [! this choise can give unexpected results];"auto"- one of the choices above is selected by determining if spectra have any possitive and any negative peaks:Below0 <- any(loadings$spc < 0);Above0 <- any(loadings$spc > 0);normalize <- (Above0 - Below0)
- facets
A logical flag. If
TRUE, spectra are plotted on separate graphs/facets (implemented by functionfacet_grid). IfFALSE, all spectra are plotted on one facet.- subTitle
The second line of title, which will be smaller and and in italics.
- names.in
DEPRECATED. Use
byinstead.- ...
(The same parameters as above).
Value
A ggplot object.
More details in package ggplot2.
Details
qplot_kSp plots spectra on one graph. qplot_kSpFacets plots spectra on separate graphs (facets).
Note
Before using as an argument loadings,
a matrix of components/loadings (loadings) must be treated
with function decomposition (or equivalent)
which converts it to hyperSpec object.
See also
Other spHelper plots:
check_palette(),
layer_spRangeMean(),
plot_colors(),
plot_hyPalette(),
plot_spCompare(),
plot_spDiff(),
plot_spDistribution(),
qplot_confusion(),
qplot_crosstab(),
qplot_infoDim(),
qplot_kAmp(),
qplot_prediction(),
qplot_spRangeCenter(),
qplot_spRangeMedian(),
qplot_spStat(),
qplot_spc(),
rmExpr(),
rm_stripes(),
stat_chull()
Other component analysis / factorisation related functions in spHelper:
getScores(),
infoDim(),
plot_spDiff(),
qplot_infoDim(),
qplot_kAmp(),
qplot_spc(),
reconstructSp(),
sortLoadings(),
unipeak(),
whichOutlier()
Examples
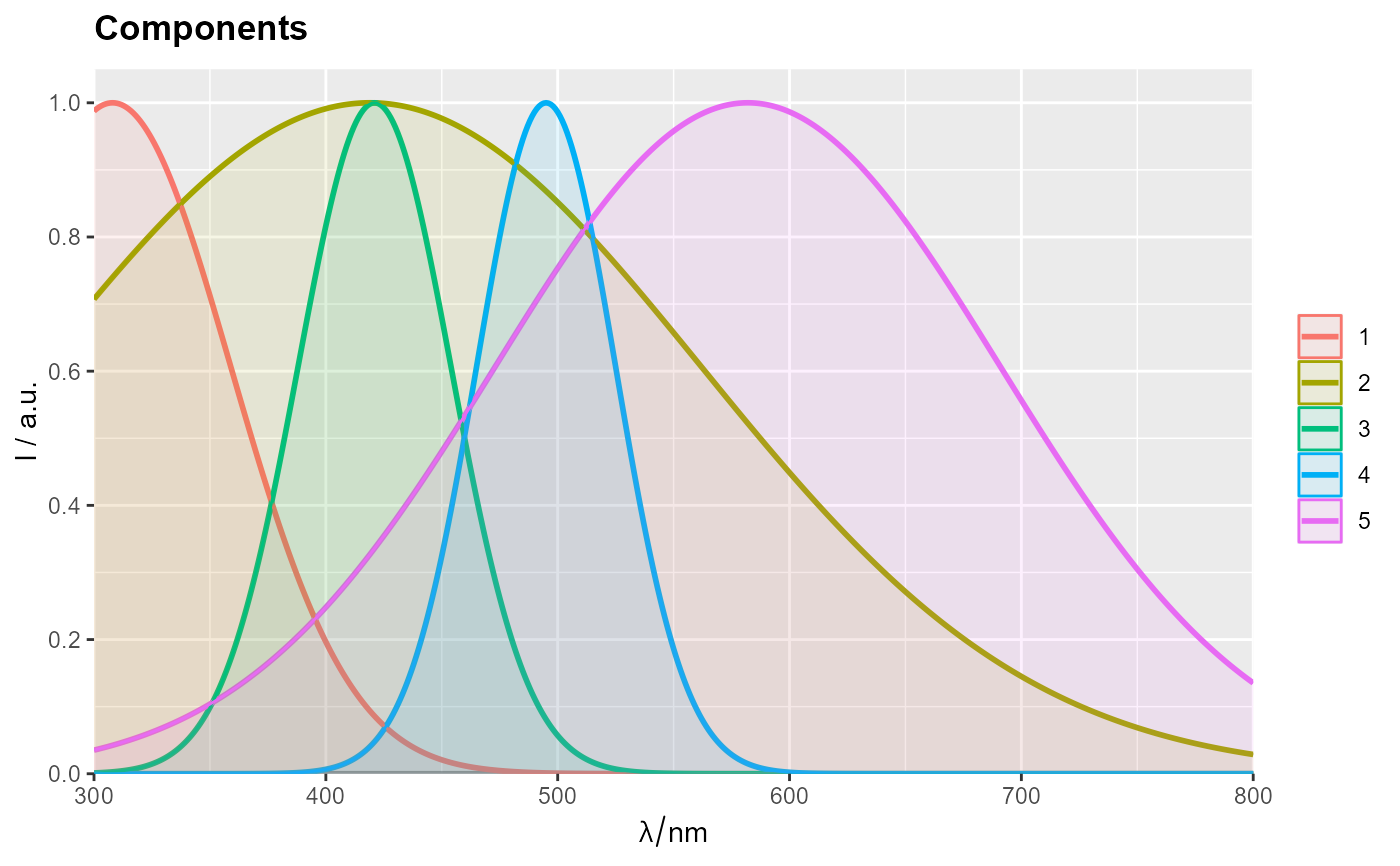
qplot_kSp(Loadings2)
#> Warning: Function 'hyperSpec::chk.hy' is deprecated.
#> Use function 'assert_hyperSpec' instead.
 data(flu, package = "hyperSpec")
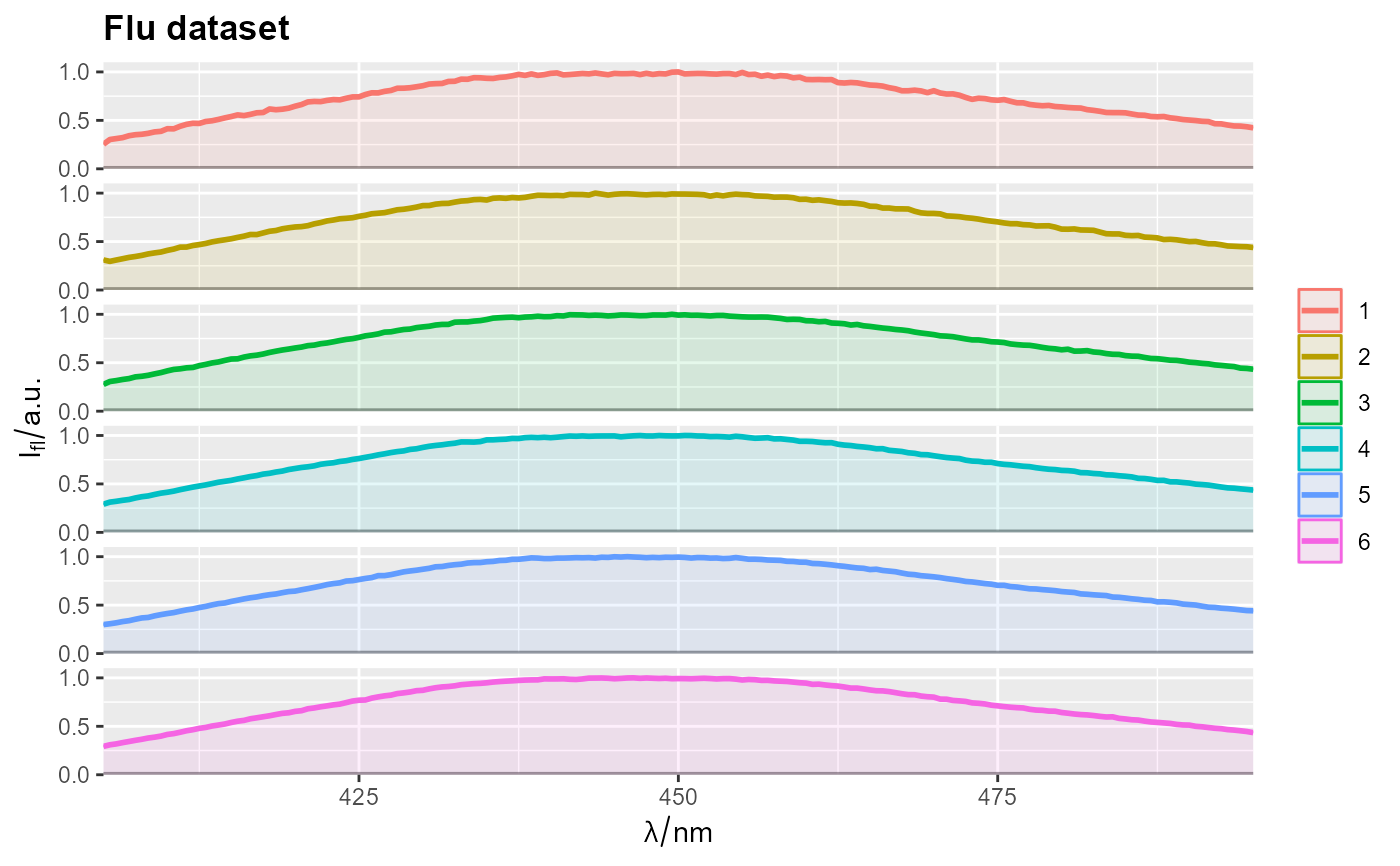
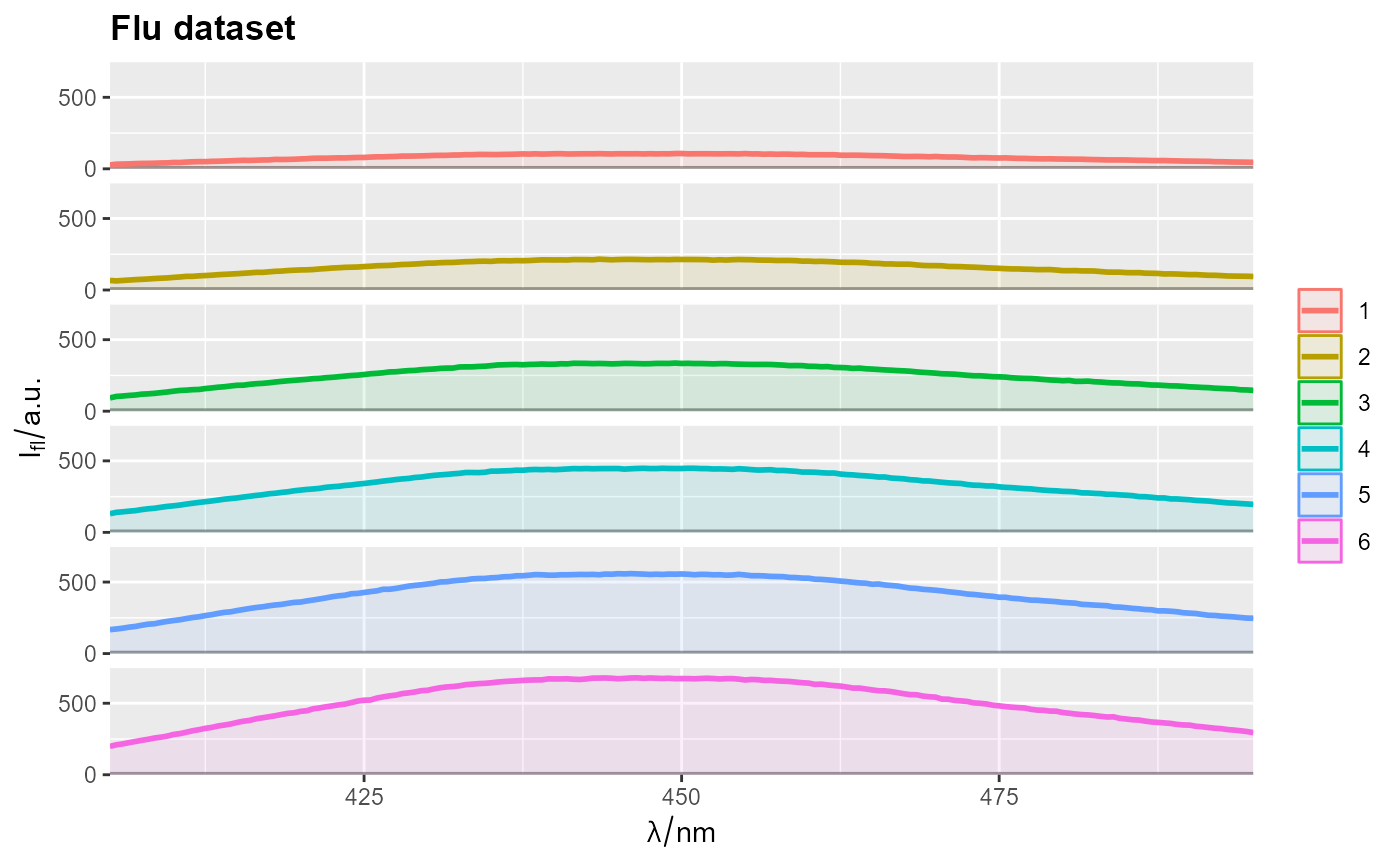
qplot_kSpFacets(flu, Title = "Flu dataset")
#> Warning: Function 'hyperSpec::chk.hy' is deprecated.
#> Use function 'assert_hyperSpec' instead.
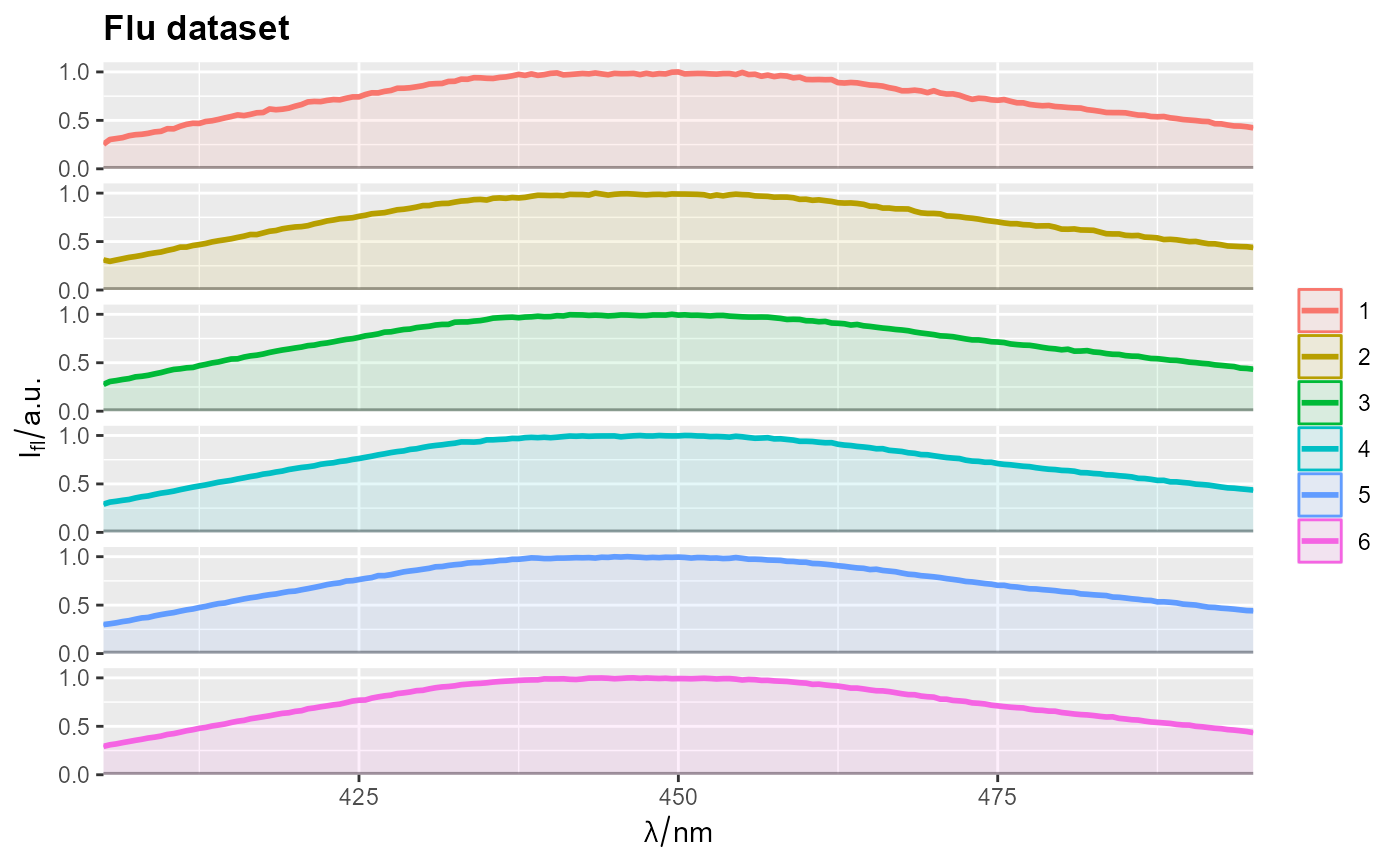
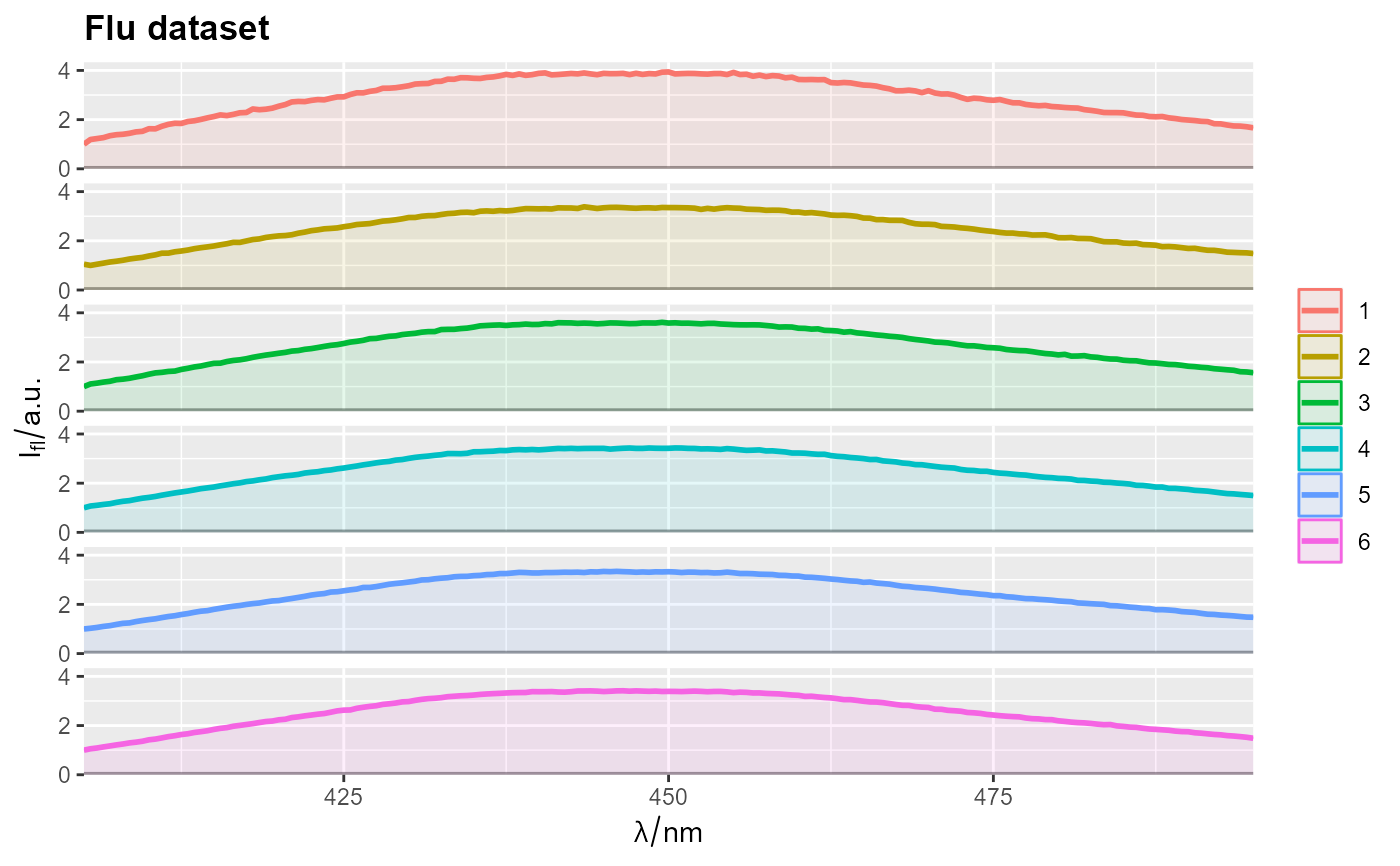
 qplot_kSpFacets(flu, Title = "Flu dataset", normalize = 1)
#> Warning: Function 'hyperSpec::chk.hy' is deprecated.
#> Use function 'assert_hyperSpec' instead.
 qplot_kSpFacets(flu, Title = "Flu dataset", normalize = FALSE)
#> Warning: Function 'hyperSpec::chk.hy' is deprecated.
#> Use function 'assert_hyperSpec' instead.
 qplot_kSpFacets(flu, Title = "Flu dataset", normalize = -1)
#> Warning: Function 'hyperSpec::chk.hy' is deprecated.
#> Use function 'assert_hyperSpec' instead.
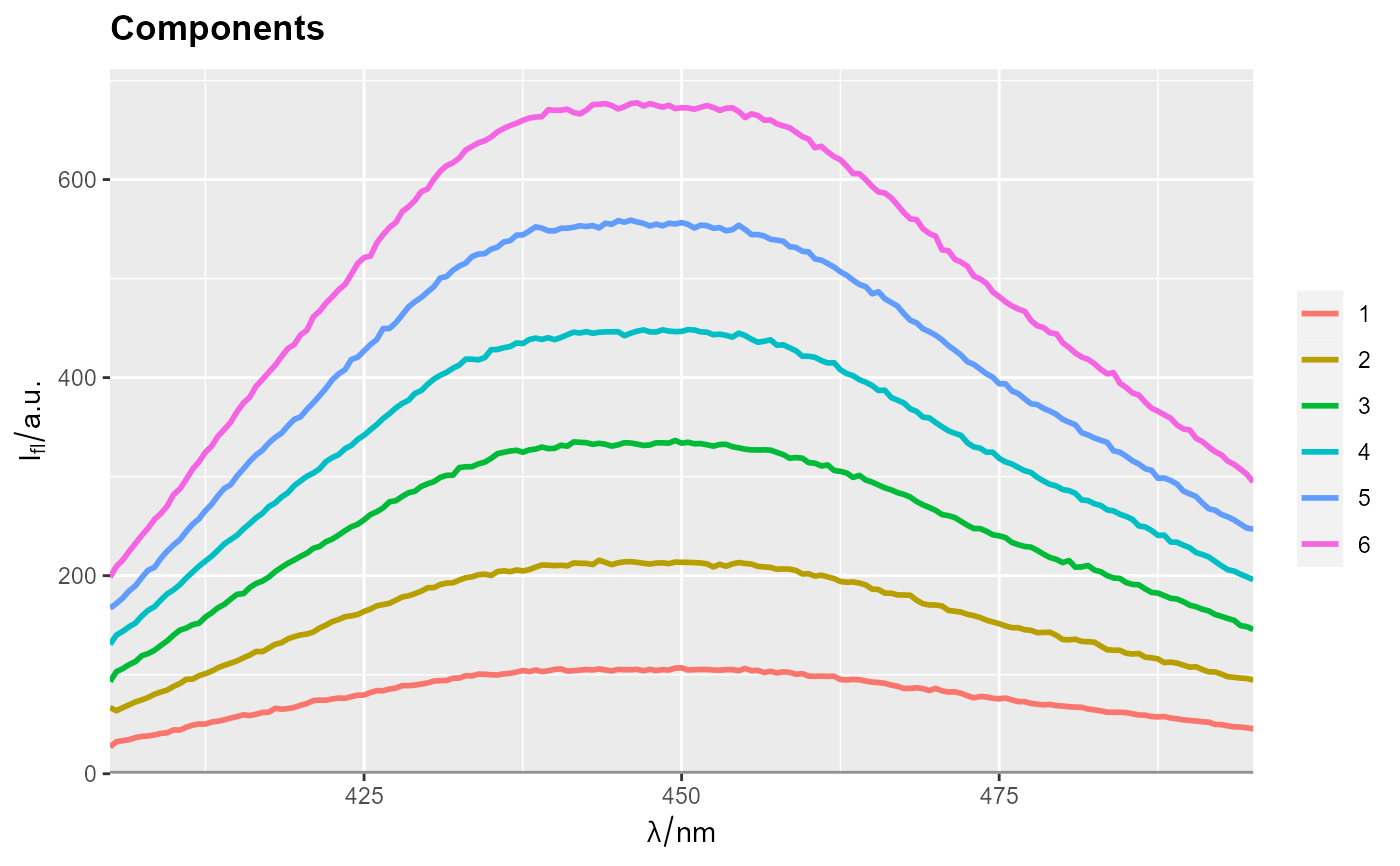
 ## Remove fill -----------------------------------------------------------------
qplot_kSp(flu, filled = FALSE)
#> Warning: Function 'hyperSpec::chk.hy' is deprecated.
#> Use function 'assert_hyperSpec' instead.
 qplot_sp(flu)
#> Warning: Function 'hyperSpec::chk.hy' is deprecated.
#> Use function 'assert_hyperSpec' instead.
 ## Name of a legend ------------------------------------------------------------
flu$c2 <- as.factor(flu$c)
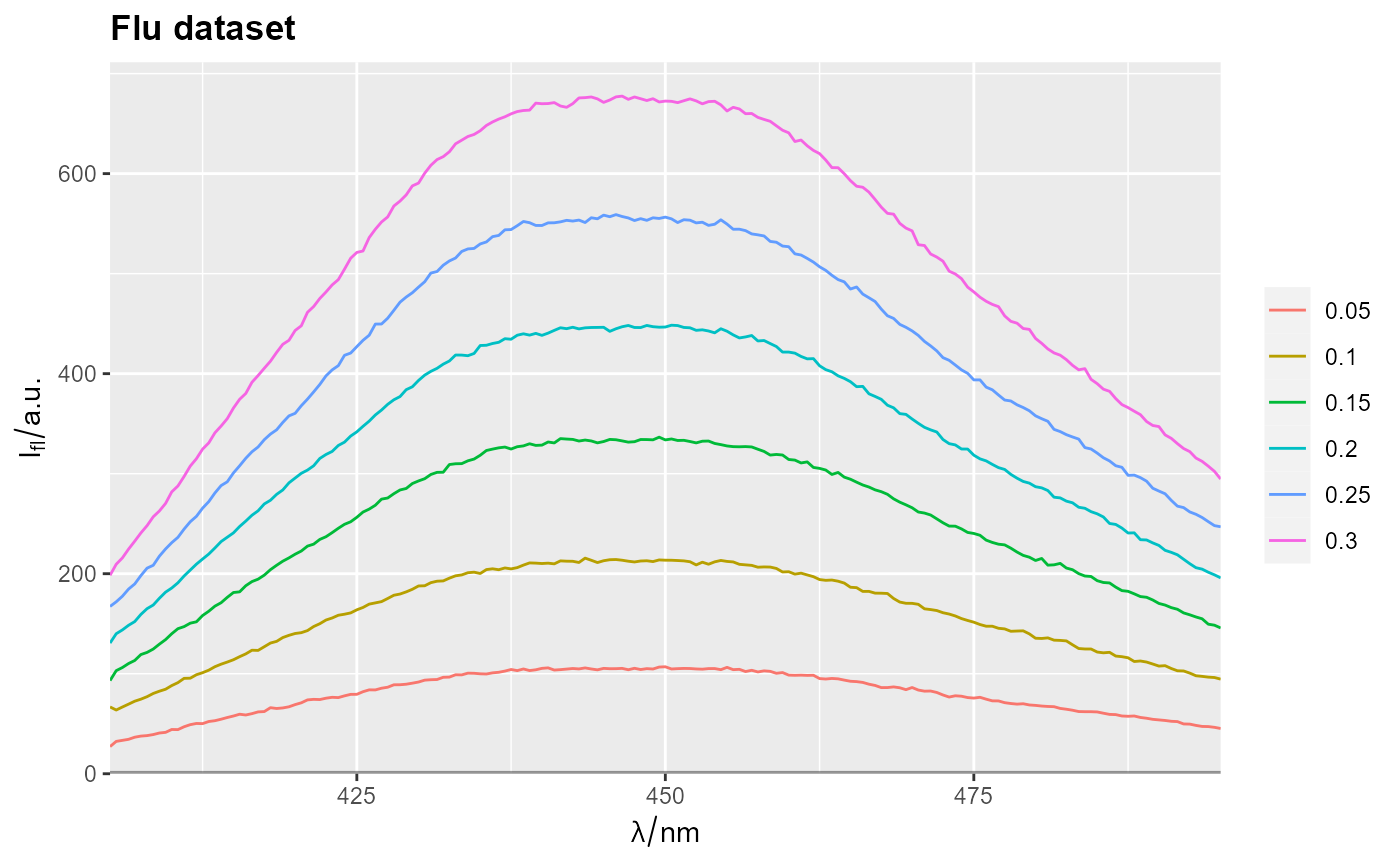
qplot_sp(flu, Title = "Flu dataset", by = 'c2', legendName = FALSE)
#> Warning: Function 'hyperSpec::chk.hy' is deprecated.
#> Use function 'assert_hyperSpec' instead.
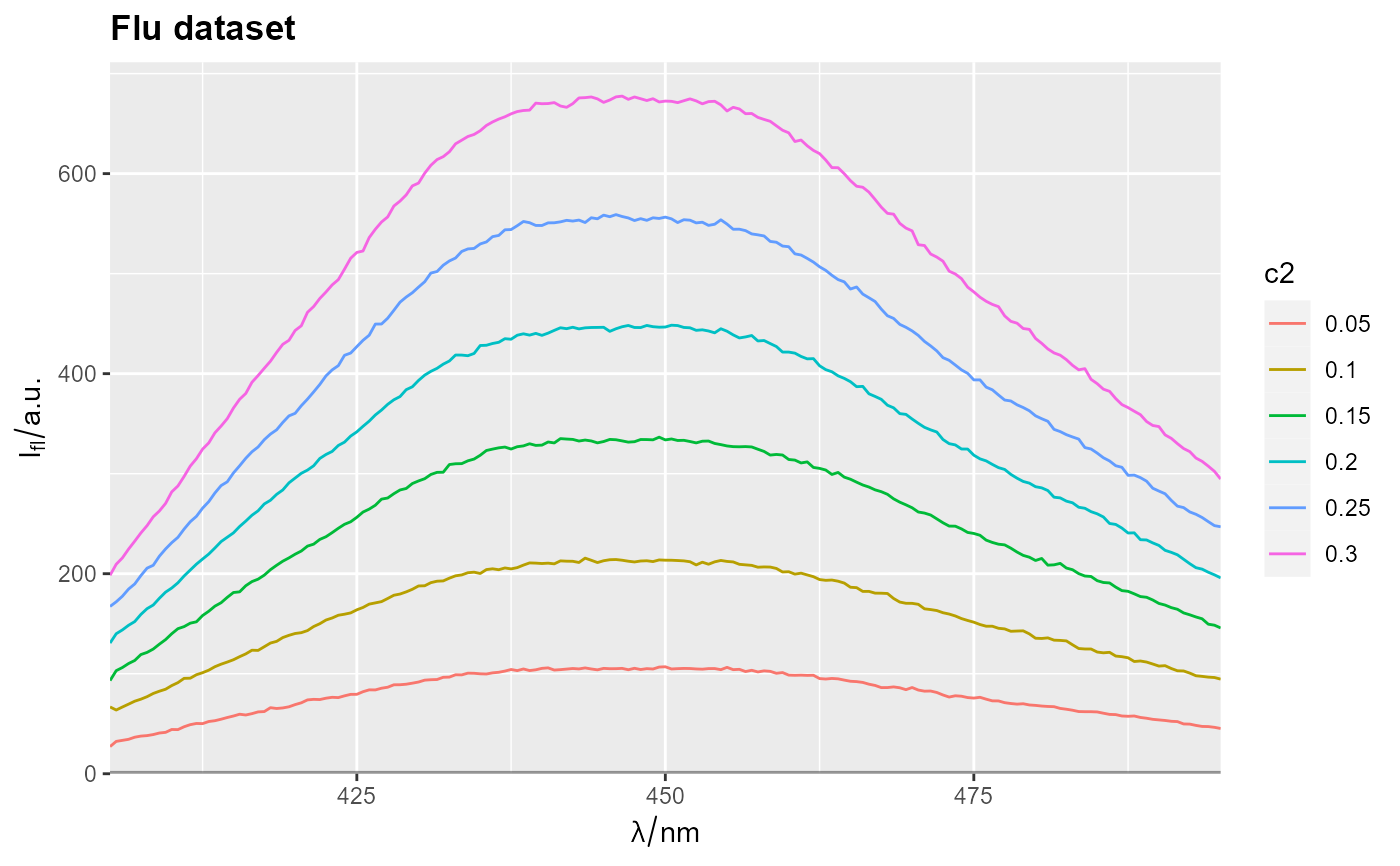
 qplot_sp(flu, Title = "Flu dataset", by = 'c2', legendName = TRUE)
#> Warning: Function 'hyperSpec::chk.hy' is deprecated.
#> Use function 'assert_hyperSpec' instead.
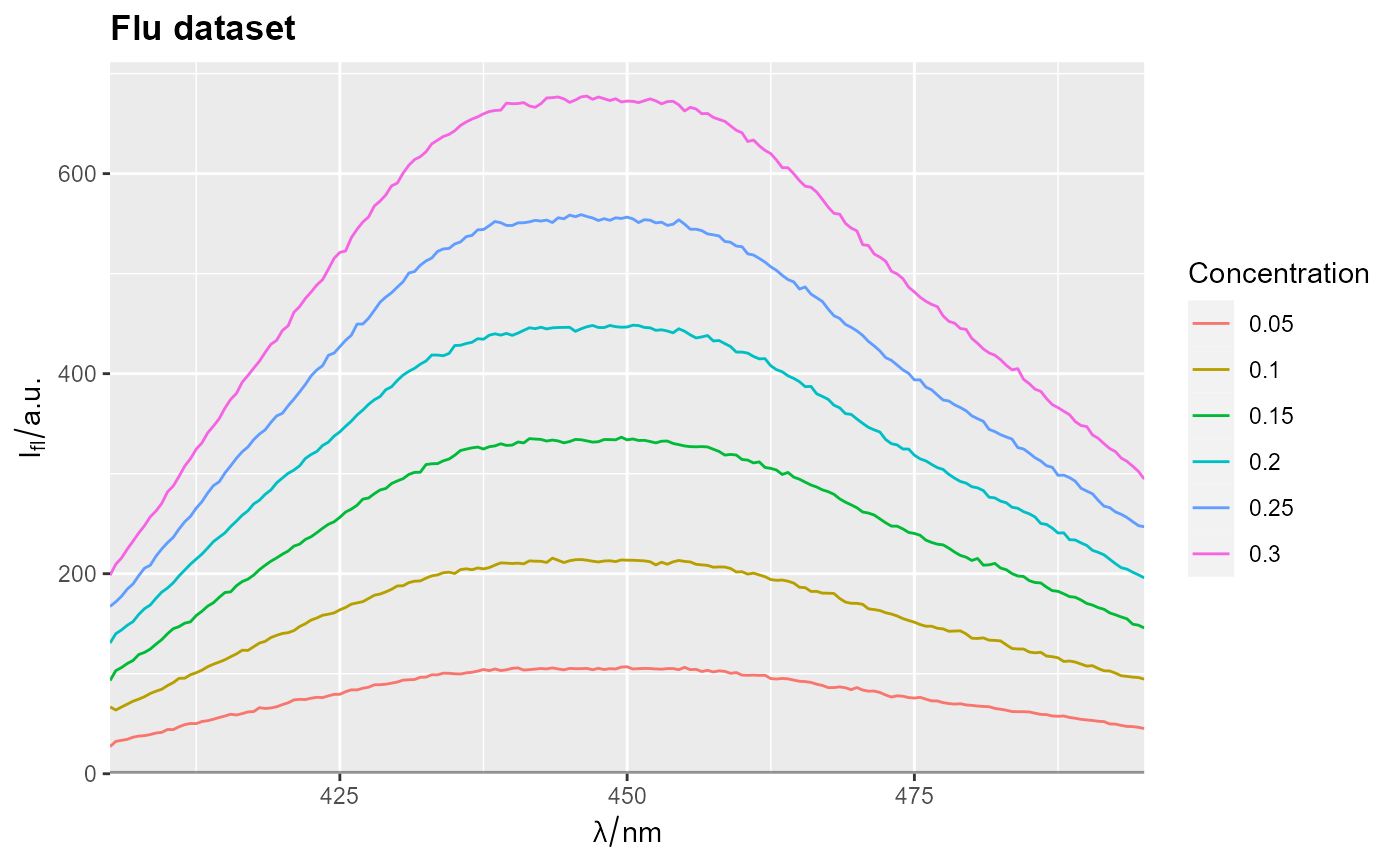
 qplot_sp(flu, Title = "Flu dataset", by = 'c2', legendName = "Concentration")
#> Warning: Function 'hyperSpec::chk.hy' is deprecated.
#> Use function 'assert_hyperSpec' instead.
 ## Example of line color transitions -------------------------------------------
qplot_sp(laser)
#> Warning: Function 'hyperSpec::chk.hy' is deprecated.
#> Use function 'assert_hyperSpec' instead.
