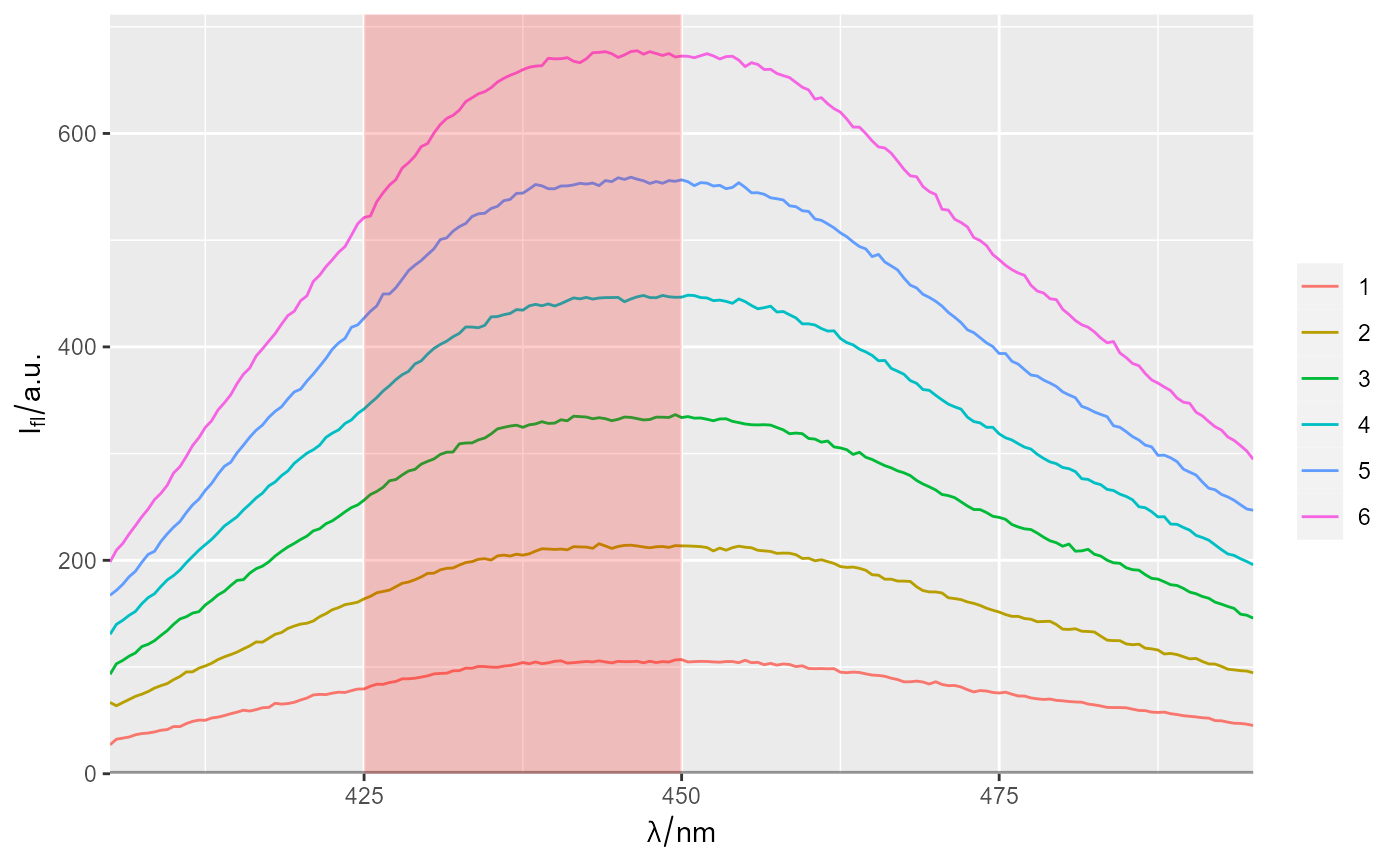
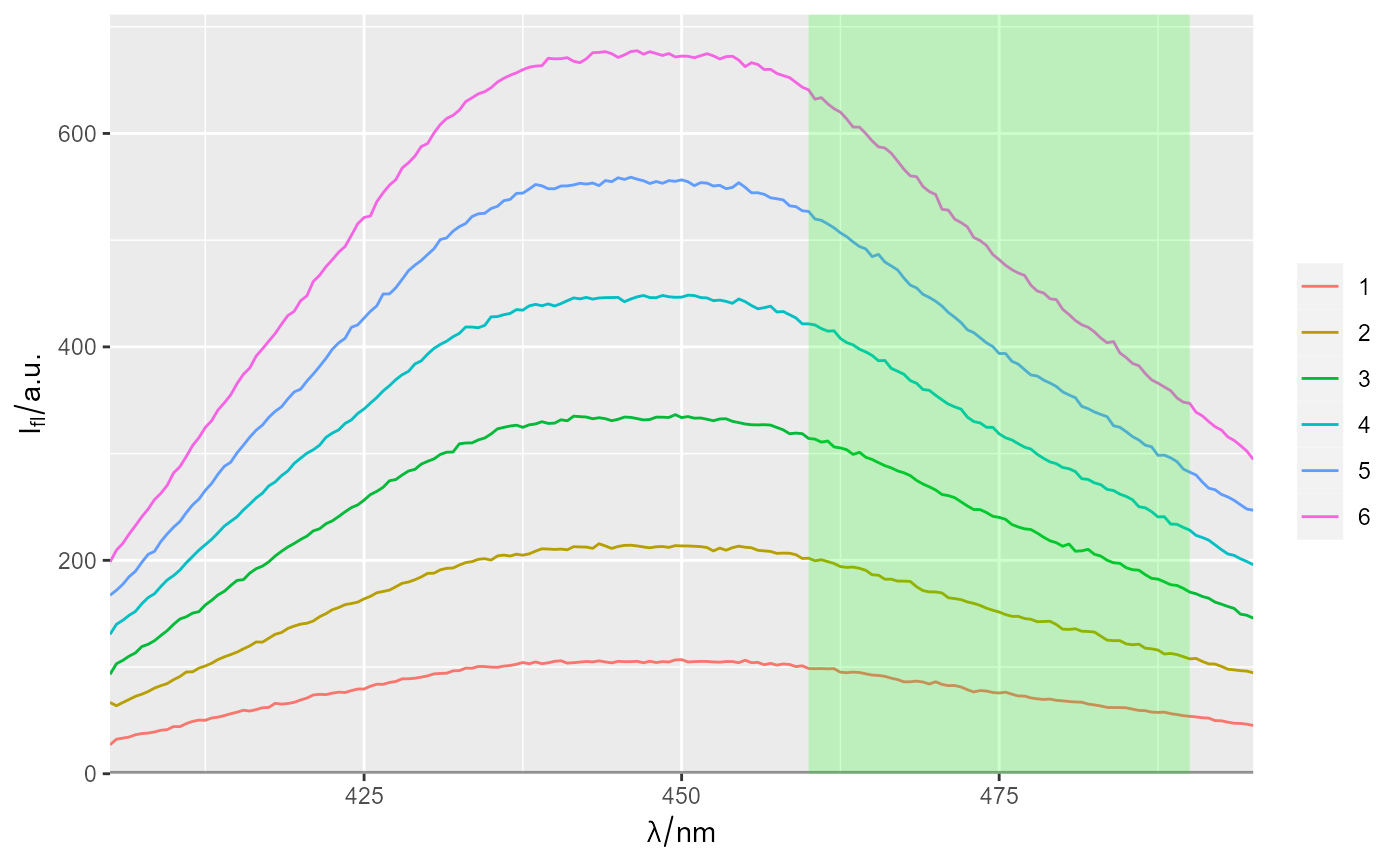
[!] Annotate x axis range in ggplot2 graphs
spZone.RdA wrapper function to annotate x axis range for ggplot2 graphs
spZone(xmin, xmax, fill = "red", alpha = 0.2, ...)

# S3 method for default
spZone(xmin, xmax, fill = "red", alpha = 0.2, ...)

# S3 method for formula
spZone(x, fill = "red", alpha = 0.2, ...)
Arguments
- xmin
Minimum value of x axis.
- xmax
Maximum value of x axis.
- fill
Fill color.
- alpha
Fill transperency.
- ...
further arguments to
annotate.- x
formula indicating min and max values (
xmin ~ xmax).

