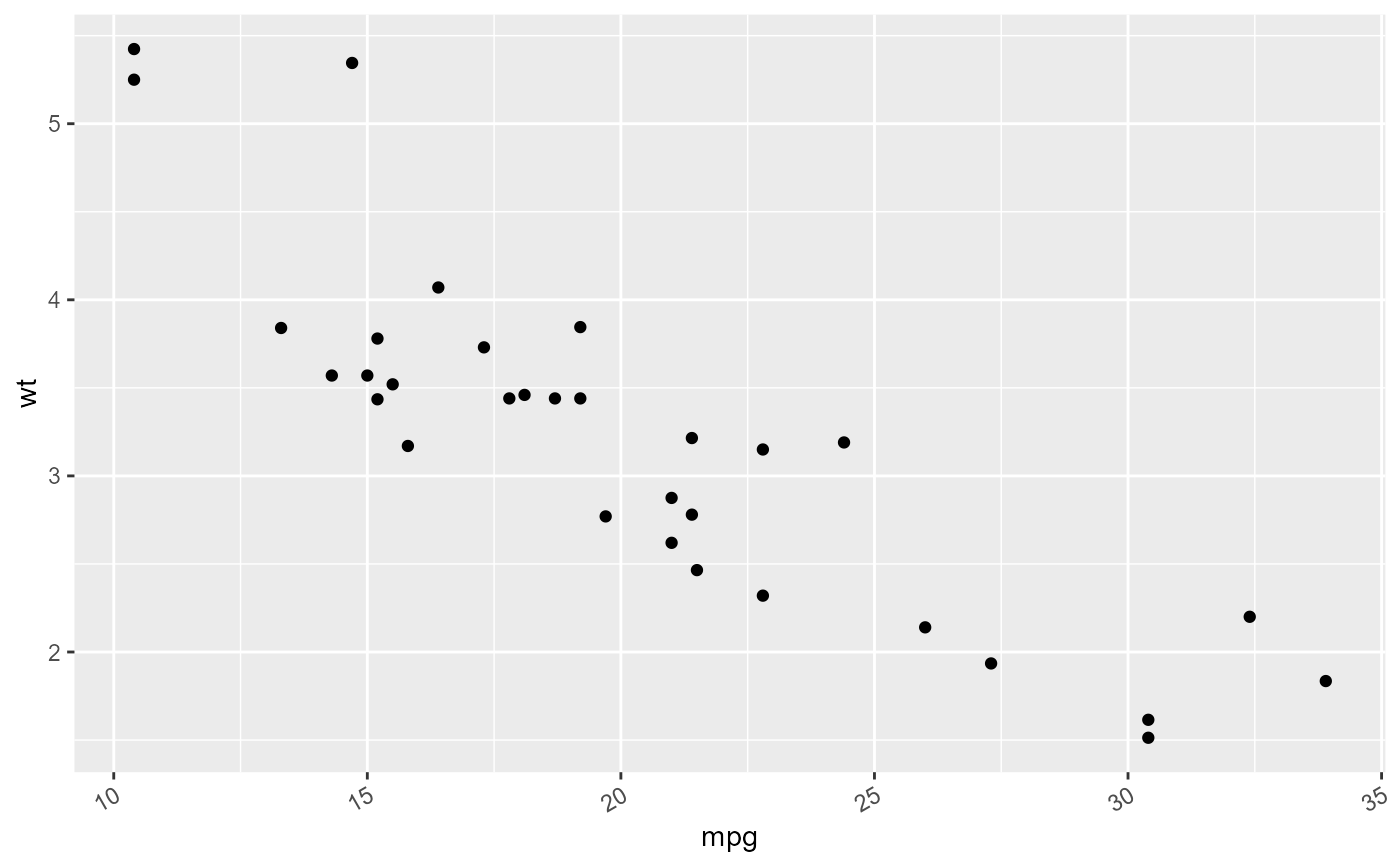
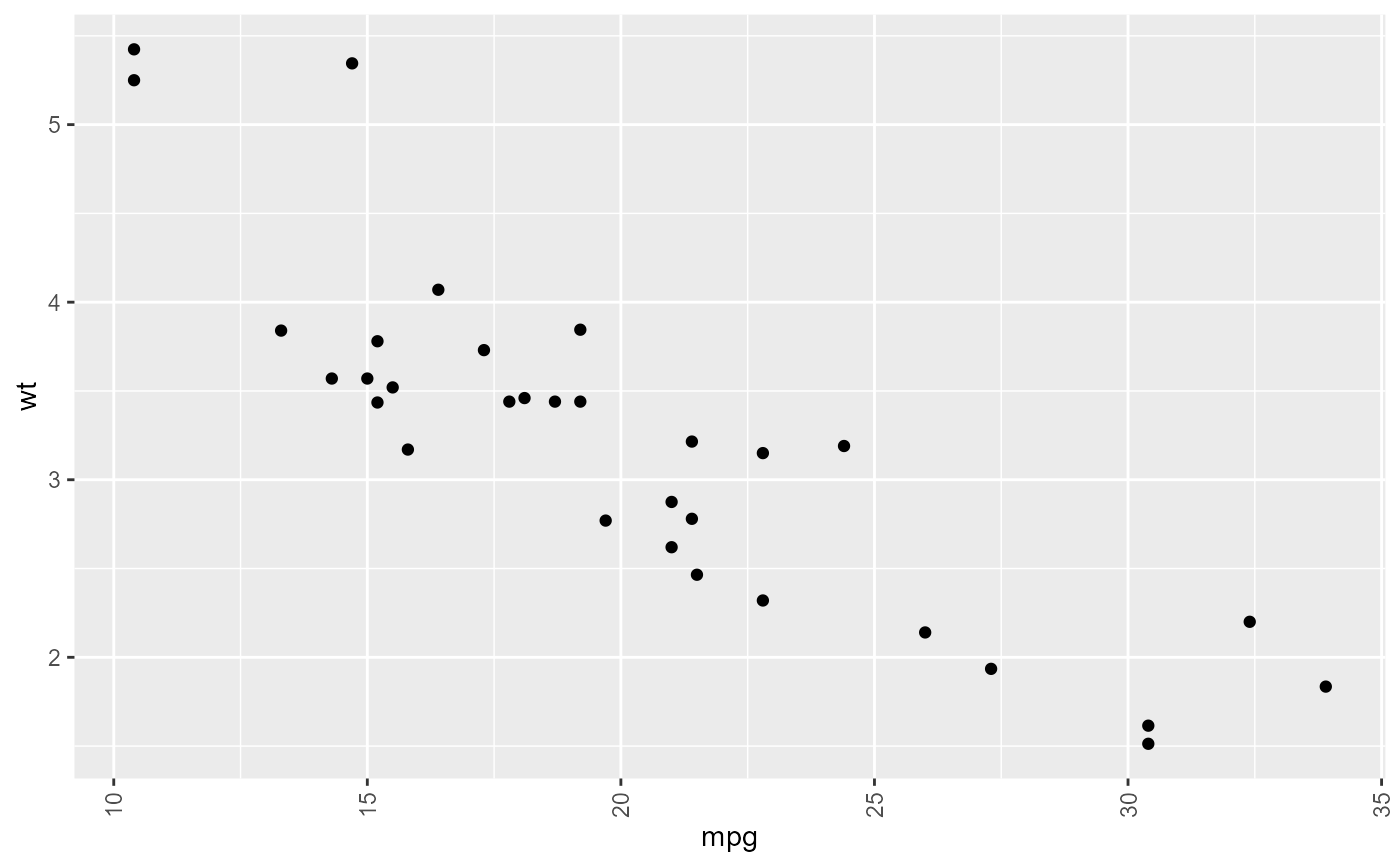
Rotate x axis tick labels
x90.RdConvenience functions to rotate x axis tick labels in ggplot plots:x30() rotates in 30 degrees.x90() rotates in 90 degrees.
x90()

x30()
Details
These functions correct ggplot2 theme elements and may not respond if
new theme is applied after e.g. x30() is apllied. I.e. INCORRECT:qplot(mpg, wt, data = mtcars) + x30() + theme_bw().
CORRECT:qplot(mpg, wt, data = mtcars) + theme_bw() + x30().

