Calculate a statistic
spStat_ci.Rd### NEBAIGTA ###
spStat_ci(
  obj,
  FUN = mean,
  label = as.character(match.call()$FUN) %if_null_or_len0% "mean"
)

spStat_ci_corr(
  obj,
  y = NULL,
  FUN = mean,
  method = c("spearman", "kendall", "pearson")[1],
  use = "everything",
  conf = 0.95,
  R = 1000,
  sim = "balanced",
  type = c("norm"),
  label = paste0(spMisc::fCap(method), "'s corr. coeff.")
)

ggplot_ci_rez(rez, linetype = 1)
Arguments
- obj
hyperSpec object.
- FUN
a function that takes a vector and results in a single number, e.g., mean, median, etc.
- label
(string) a label for function to be used as column name.
- y
a vector.
- method
a character string indicating which correlation coefficient (or covariance) is to be computed. One of
"pearson"(default),"kendall", or"spearman": can be abbreviated.- use
an optional character string giving a method for computing covariances in the presence of missing values. This must be (an abbreviation of) one of the strings
"everything","all.obs","complete.obs","na.or.complete", or"pairwise.complete.obs".- conf
A scalar or vector containing the confidence level(s) of the required interval(s).
- R
The number of bootstrap replicates. Usually this will be a single positive integer. For importance resampling, some resamples may use one set of weights and others use a different set of weights. In this case
Rwould be a vector of integers where each component gives the number of resamples from each of the rows of weights.- sim
A character string indicating the type of simulation required. Possible values are
"ordinary"(the default),"parametric","balanced","permutation", or"antithetic". Importance resampling is specified by including importance weights; the type of importance resampling must still be specified but may only be"ordinary"or"balanced"in this case.- type
A vector of character strings representing the type of intervals required. The value should be any subset of the values
c("norm","basic", "stud", "perc", "bca")or simply"all"which will compute all five types of intervals.- rez
a rezult of function
spStat_ci_corrorspStat_ci
Examples
rez <- spStat_ci(Spectra2)
rez
#> hyperSpec object
#> 3 spectra
#> 2 data columns
#> 501 data points / spectrum
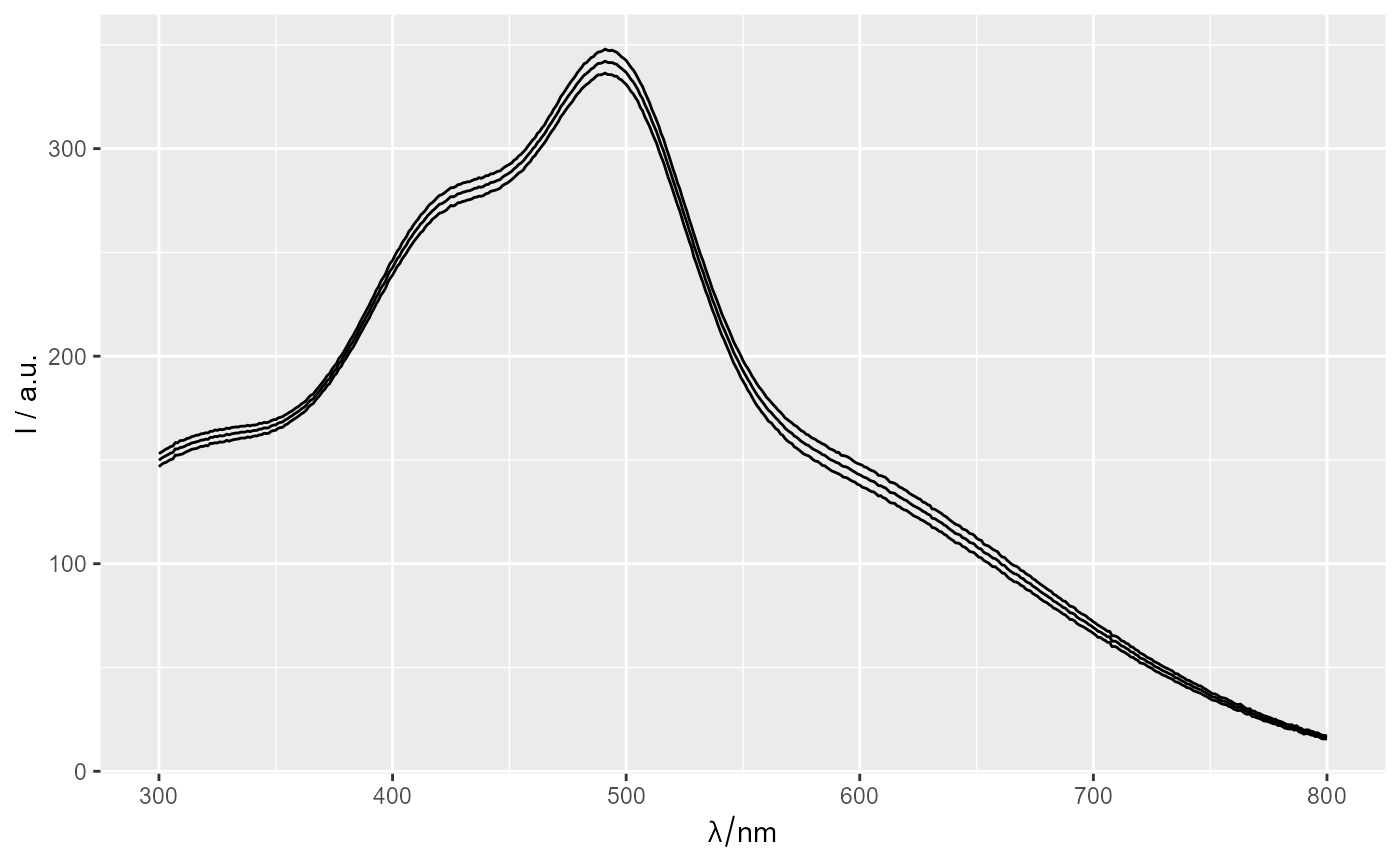
qplotspc(rez)
#> Warning: Function 'qplotspc' is deprecated.
#> Use function 'qplotspc' from package 'hySpc.ggplot2' instead.
#> https://r-hyperspec.github.io/hySpc.ggplot2
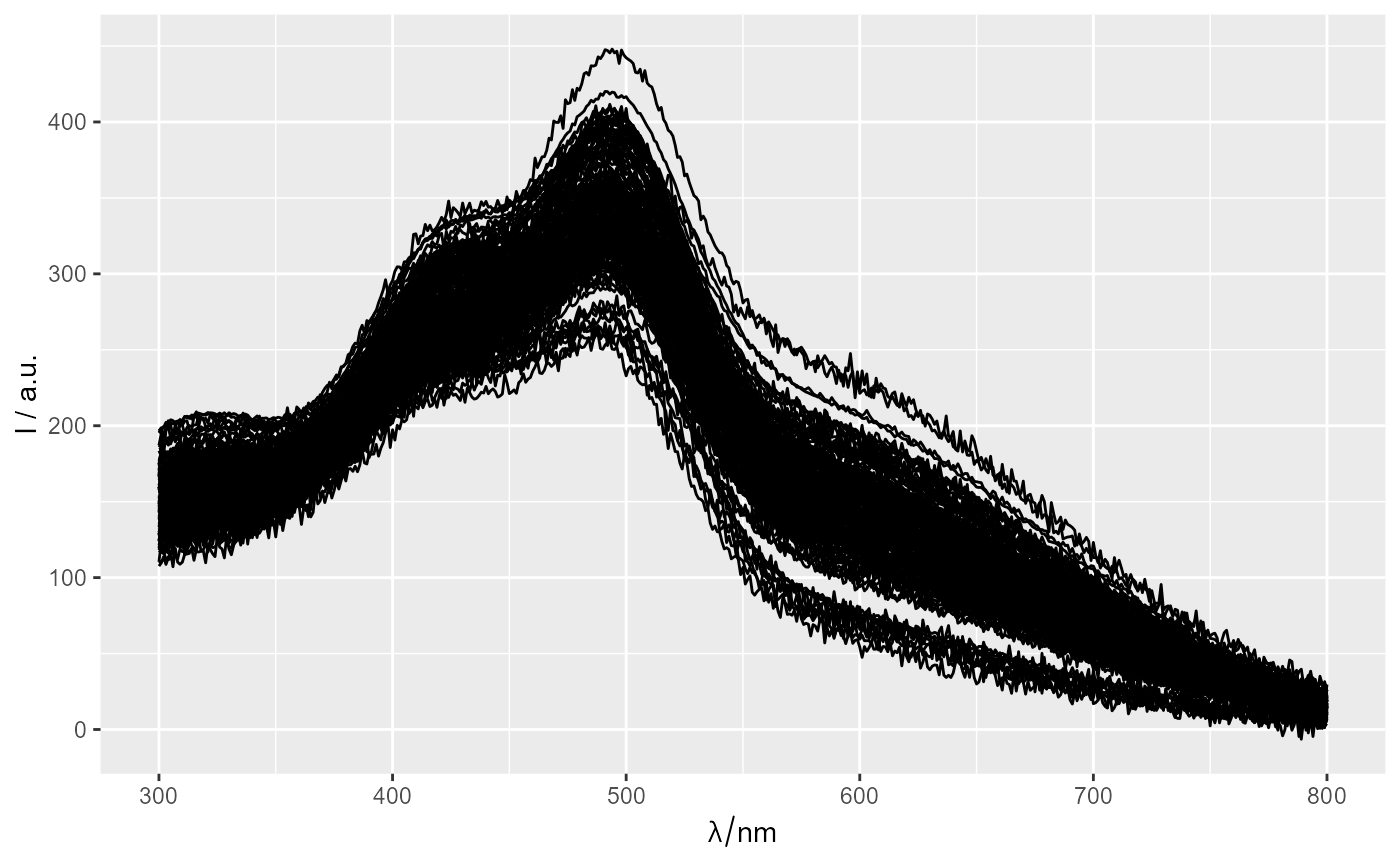
 ggplot(Spectra2) + geom_line()
#> Warning: Function 'chk.hy' is deprecated.
#> Use function 'assert_hyperSpec' instead.
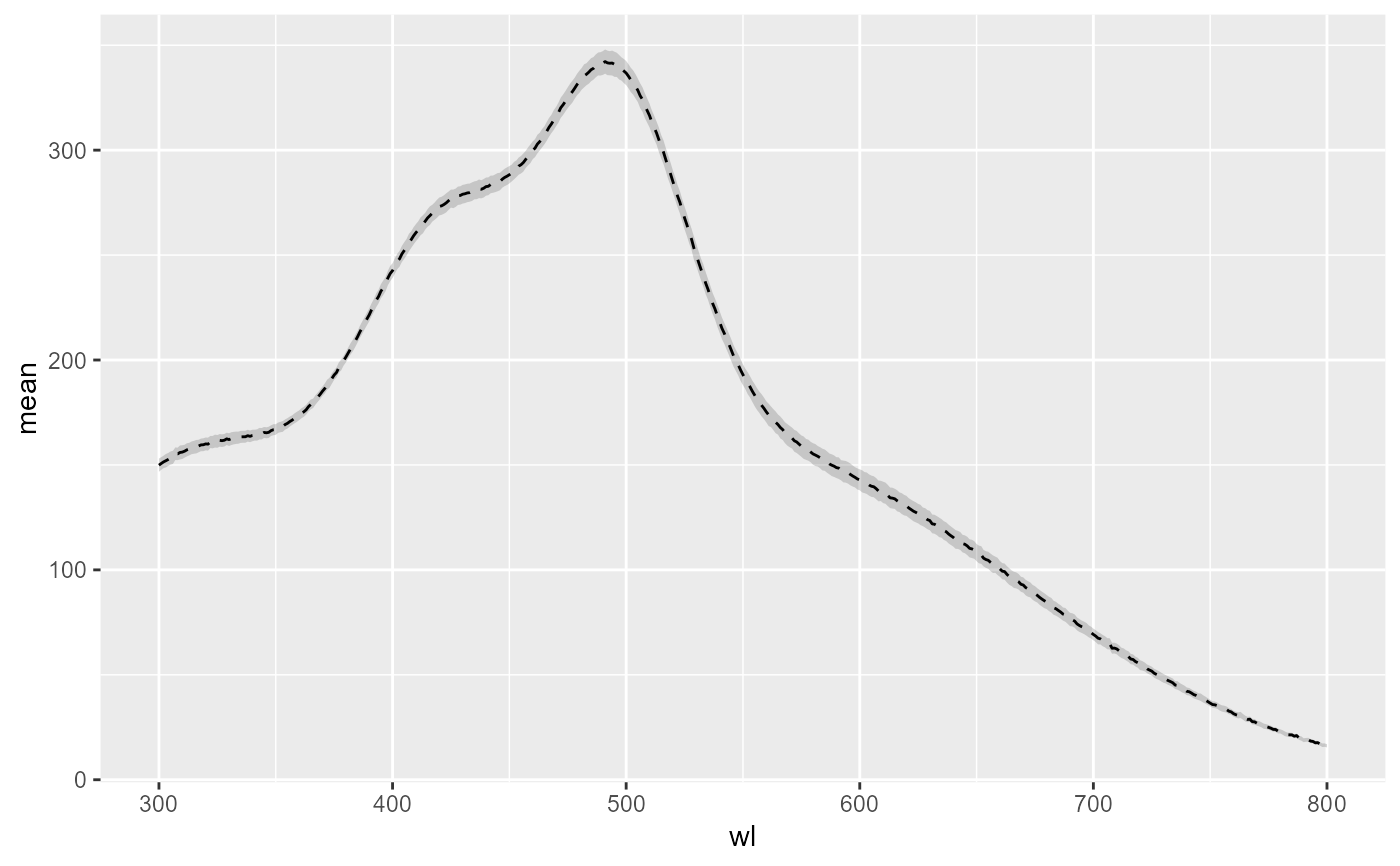
 data <- hy_spc2df(rez)
ggplot(data,
aes_string(x = "wl",
y = names(data)[3],
ymin = "ci_lower",
ymax = "ci_upper")
) +
geom_ribbon(alpha = 0.2) +
geom_line(linetype = 2)
#> Warning: `aes_string()` was deprecated in ggplot2 3.0.0.
#> ℹ Please use tidy evaluation idioms with `aes()`.
#> ℹ See also `vignette("ggplot2-in-packages")` for more information.
 ggplot(Spectra2[1:20,,300~400])
#> Warning: Function 'chk.hy' is deprecated.
#> Use function 'assert_hyperSpec' instead.
 hyperSpec::aggregate(Spectra2, by = "gr", FUN = mean)
#> hyperSpec object
#> 1 spectra
#> 4 data columns
#> 501 data points / spectrum
set.seed(1)
amzius <- rnorm(nrow(Spectra2))
spektrai <- Spectra2[,,400~500]
set.seed(1)
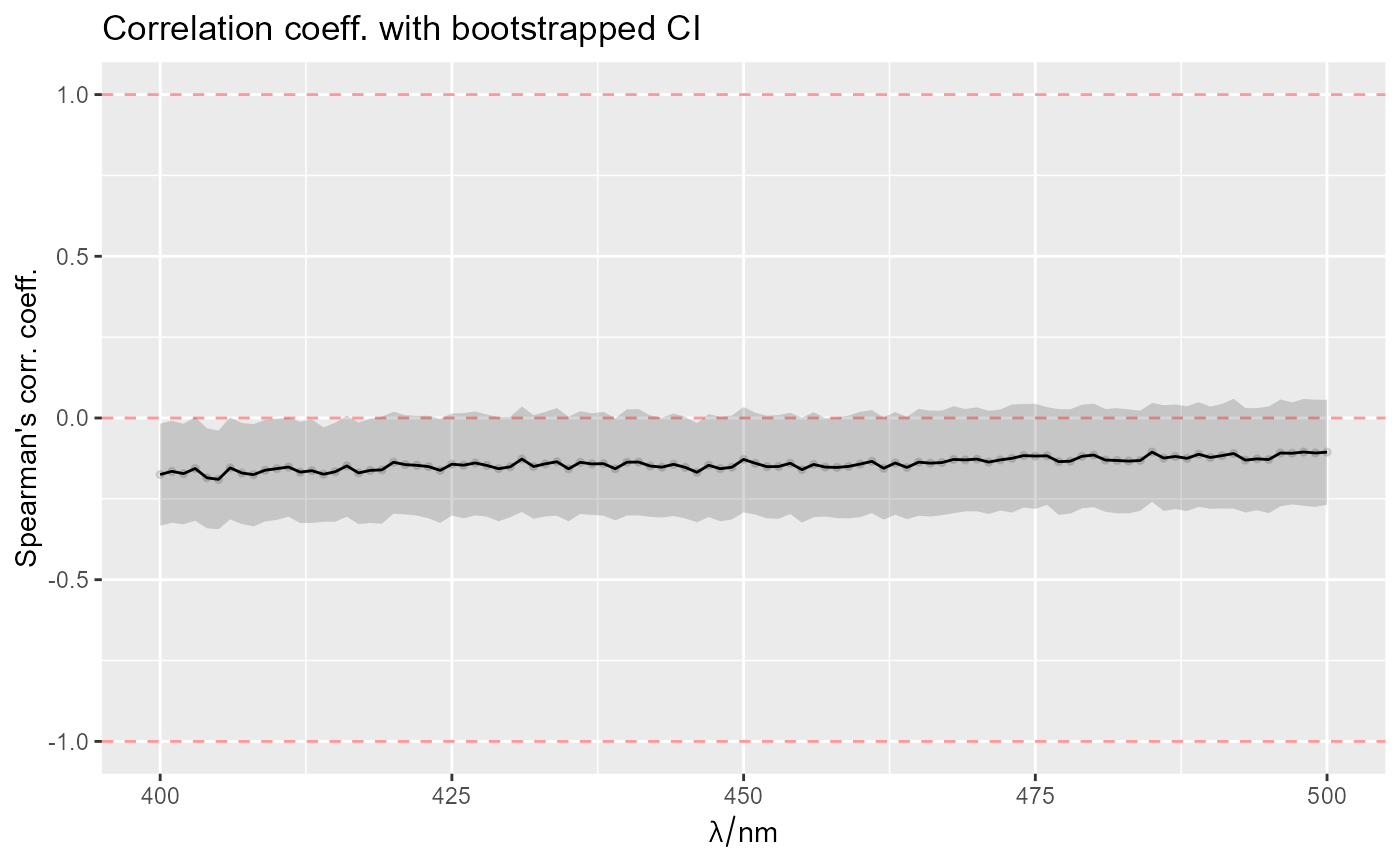
rez <- spStat_ci_corr(spektrai, y = amzius)
ggplot_ci_rez(rez)
