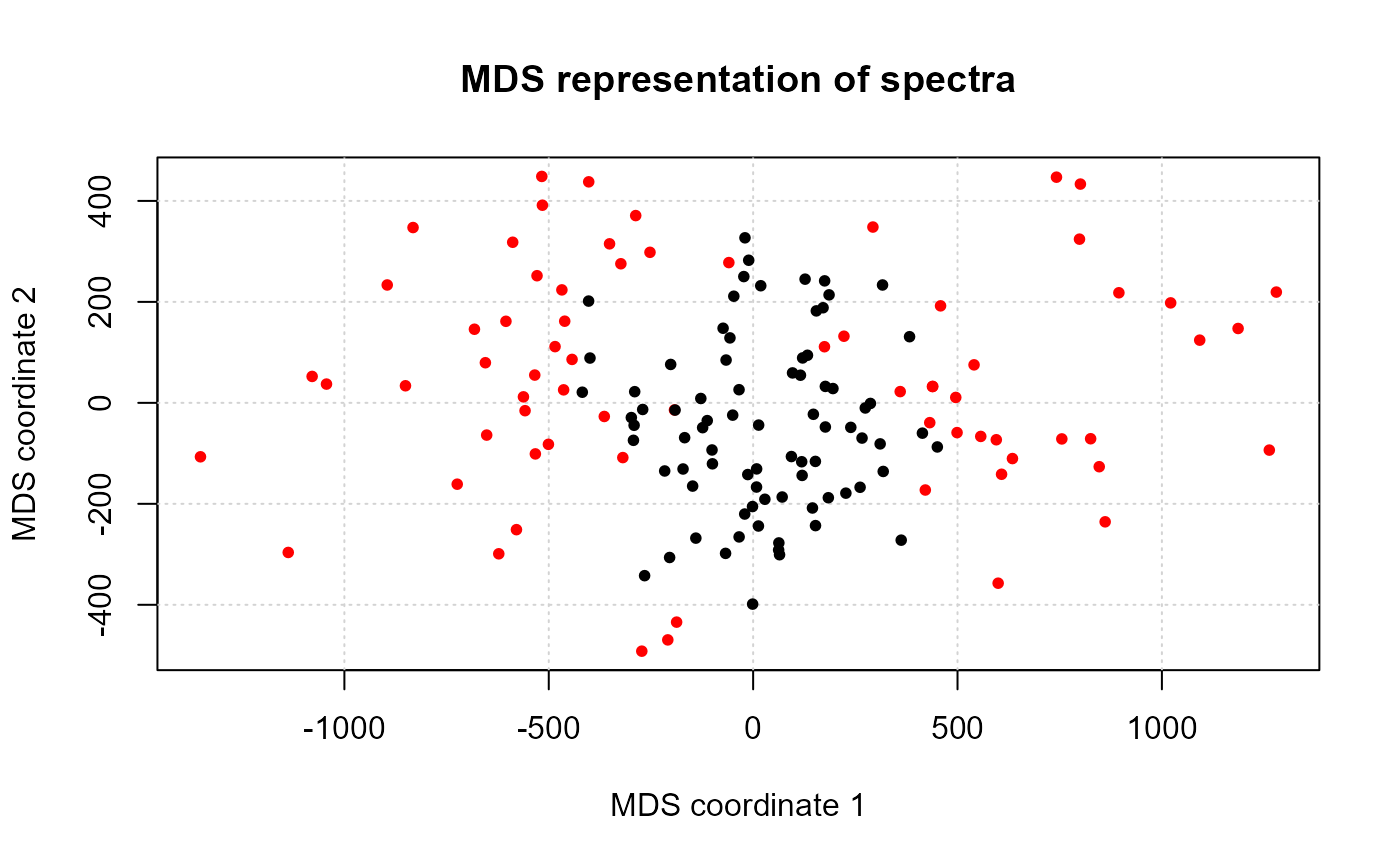
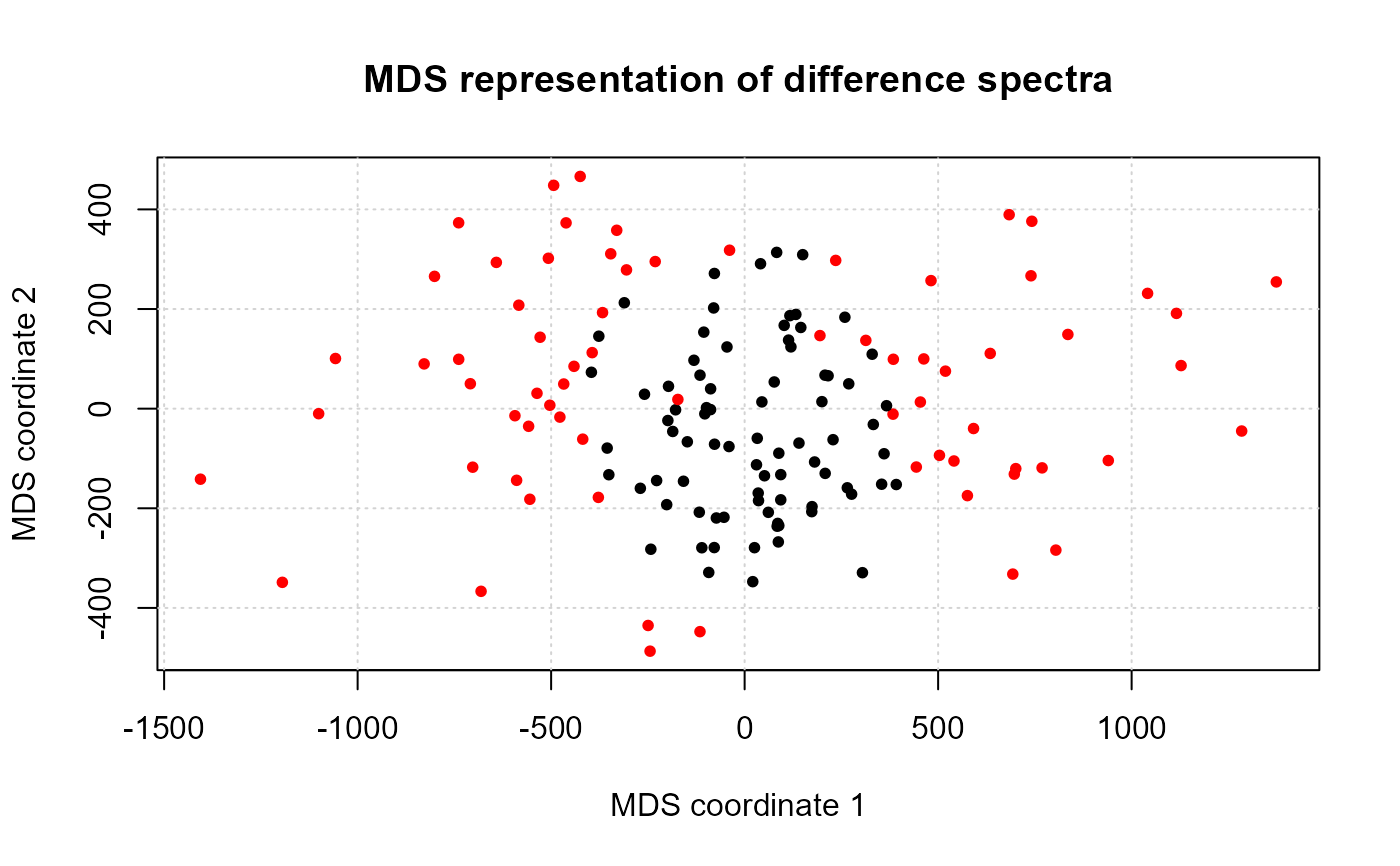
Plot MDS of LOF_obj data
plot_LOF_MDS.RdPlot MDS of LOF_obj data
Arguments
- obj
- either "LOF_obj" object or "hyperspec" object.
- type
- type of plot, string wit one of the following: "data", "differences", "centers". May be abbreviated.
- LOF_threshold
- LOF threshold values. Rows (lines) that have threshold above
- x, y
position of legend. See
legend.- colors
Colors names for LOF below and above threshold default are:
c("black", "red").- LOF
- vector of lack-of-fit values for every row;
See also
Other LOF_obj:
get_LOF_by_class(),
plot_LOF_hist(),
plot_LOF_sp(),
plot_stacked()
Examples
library(spHelper)
obj <- get_LOF_by_class(Spectra2, "class")
#> Warning: Function 'chk.hy' is deprecated.
#> Use function 'assert_hyperSpec' instead.

plot_LOF_MDS(obj, "data",        x = NULL)

plot_LOF_MDS(obj, "differences", x = NULL)

plot_LOF_MDS(obj, "centers",     x = NULL)
