[!] Plot crosstab for 2 variables in hyperSpec object
gg_crosstab2.Rd[!] Plot crosstab for 2 variables in hyperSpec object
Arguments
- sp
hyperSpecobject.- x_var,
y_var names of variables inside
sp, that contain information to be crosstabulated.- xLabel,
yLabel labels for variables
x_var, y_varrespectively.- ID_var
name of variable inside
sp, that contain ID of sample.- rotate.x.tick.labels
Determine if x axis tick labels should be rotated in 45 degrees angle (to avoid overlapping). Possible valued
TRUE,FALSEorNULL(default, rotate if maximum length of x tick label is more that 3 symbols).- useNA
whether to include
NAvalues in the table. See ‘Details’. Can be abbreviated.
Value
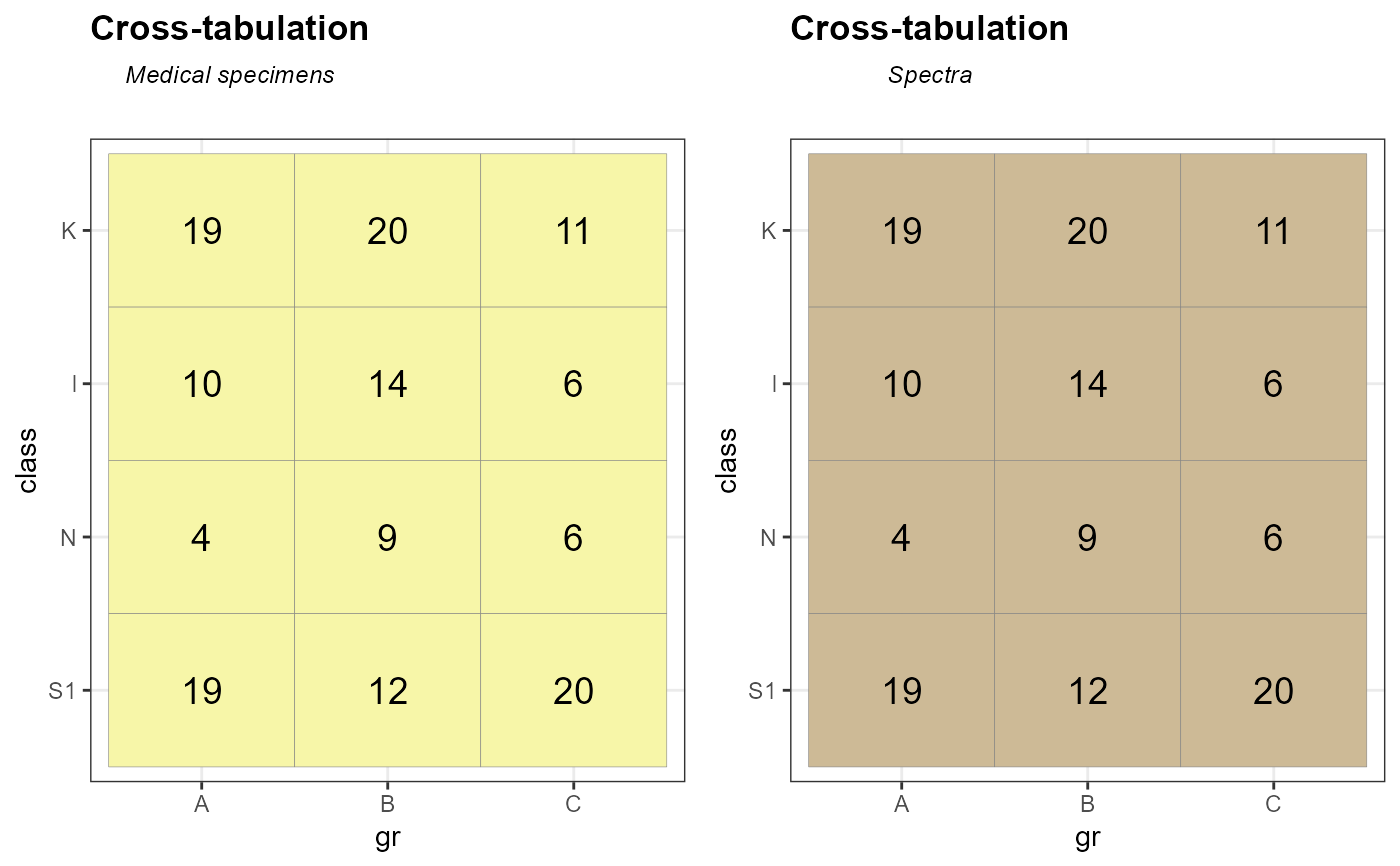
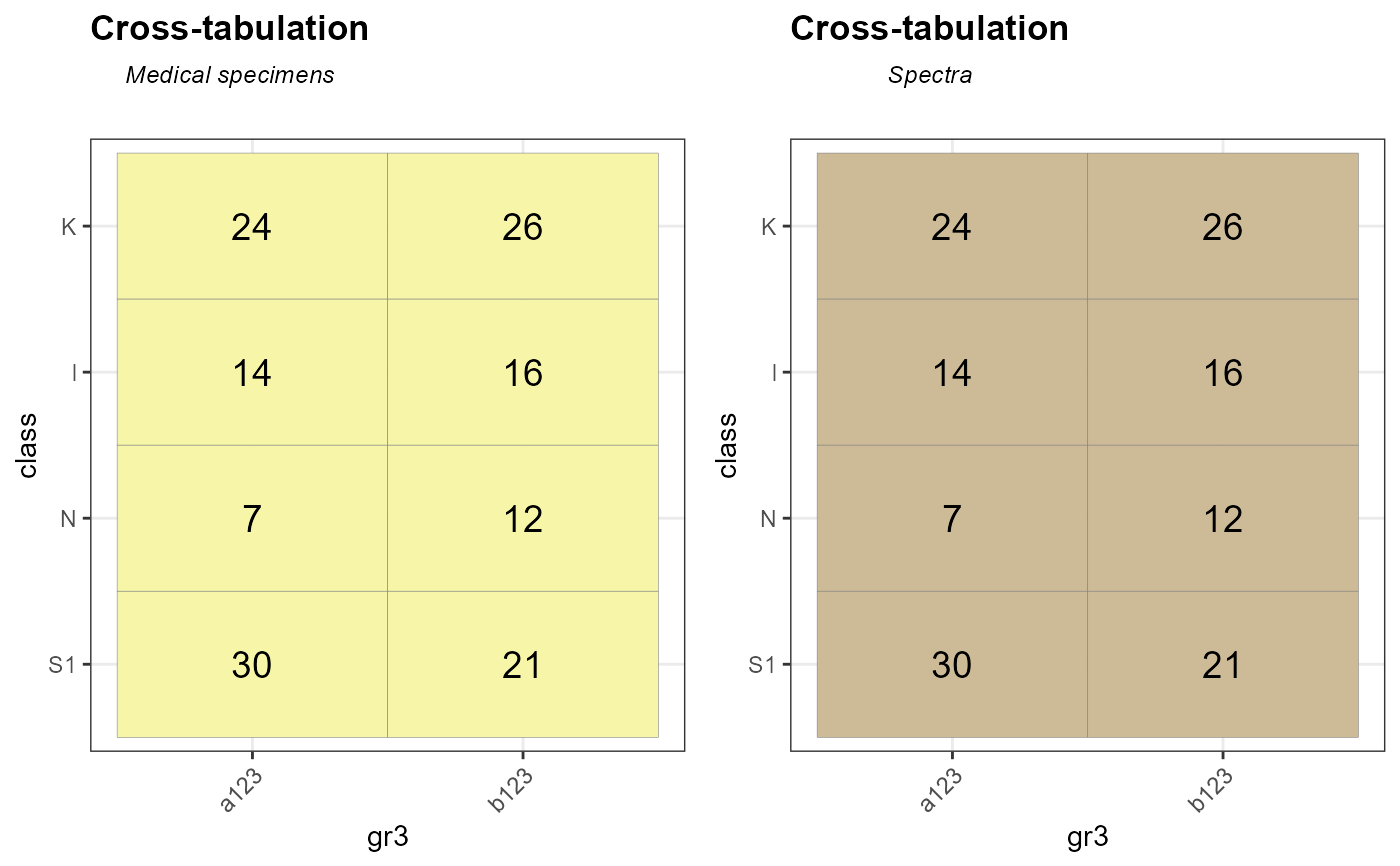
2 ploted crosstabs: first for number of medical samples, second for number of spectra.
Examples
library(spHelper)

gg_crosstab2(Spectra2,"gr","class", ID_var = NULL)
#> Warning: The `guide` argument in `scale_*()` cannot be `FALSE`. This was deprecated in
#> ggplot2 3.3.4.
#> ℹ Please use "none" instead.
#> ℹ The deprecated feature was likely used in the spHelper package.
#>   Please report the issue to the authors.


Spectra2$gr3<- c("a123", "b123")
gg_crosstab2(Spectra2,"gr3","class", ID_var = NULL)
