Examples how to use
knitrContainer
(knitrContainer v0.0.28)
Vilmantas Gegzna
2023-04-11
Source:vignettes/v1_examples.Rmd
v1_examples.RmdIntroduction
About knitrContainer
knitrContainer is an R package designed to collect
objects and print them in knitr reports.
How to install the package?
From Git Hub repository:
library(devtools)
install_github("GegznaV/knitrContainer")
How to use knitrContainer?
Only 4 things should be done for basic use of
knitrContainer package :
- Create a container(e.g. function
knitrContainer()); - Add objects to the container (use
add_as_*family functions, e.g. functionadd_as_is()); - In a R code chunk of
knitrreport file set optionresultstoresults='asis'; - Print the objects appropriately: apply function
print_all()in the chunk which has optionresults='asis'.
Example 1
container <- knitrContainer()
container <- add_as_text(container, "Text to be added.")
print_all(container)
Example 2
Example how to add objects using the operator %<>%
from package magrittr:
container %<>%
    add_as_text("Text added using `%<>%` operator.")
It is the same as:
container <- add_as_text(container, "Text added using `<-` operator.")Type the following code in R to learn more about operator
%<>%:
`?`(`%<>%`)More detailed examples are presented in the following sections.
Functions for class knitrContainer
Load packages
… and create necessary objects
plotly_obj <- plot_ly(CO2, x = ~conc, y = ~uptake, type = "box", showlegend = FALSE)

ggplot_obj <- qplot(mpg, wt, data = mtcars, colour = cyl)
#> Warning: `qplot()` was deprecated in ggplot2 3.4.0.
#> This warning is displayed once every 8 hours.
#> Call `lifecycle::last_lifecycle_warnings()` to see where this warning was
#> generated.
Create a knitrContainer object
container <- knitrContainer()
class(container)
#> [1] "knitrContainer" "list"
container
#> *** Empty container ***
Attach objects to the end of the container
# Section headings
container <- add_as_heading1(container, "Plots")

# Add `plotly` objects as `htmlwidgets`
container <- add_as_heading2(container, "Add `plotly` as `plotly htmlwidget`")
container <- add_as_plotly_widget(container, plotly_obj)

# Add `ggplot` objects as plotly `htmlwidgets`
container <- add_as_heading2(container, "Add `ggplot` as `plotly htmlwidget`")
container <- add_as_plotly_widget(container, ggplotly(ggplot_obj))

# Add `ggplot` objects as `ggplot` objects
container <- add_as_heading2(container, "Add `ggplot` as-is")
container <- add_as_is(container, ggplot_obj)

# If `plotly` objects are aded as-is, they might not be plotted
container <- add_as_heading1(container, "Attention: Not Plotted")
container <- add_as_is(container, plotly_obj)
container <- add_as_text(container, paste("As you noticed, the last", "`plotly` object was not plotted as it was added with ",
    "`add_as_is()` and not with `add_as_plotly_widget()`"))

# --- Calculations ---
SUMMARY <- summary(mtcars[1:4])

# --- Add `pander` tables ---
container <- add_as_heading1(container, "Print SUMMARY as pander table and as text")

# Add objects, printed as `pander` tables
container <- add_as_heading2(container, "As pander table")
container <- add_as_pander(container, SUMMARY)

# Add as R output text
container <- add_as_heading2(container, "As Code/ Output Text")

container <- add_as_text(container, "Not highlighted")
container <- add_as_code(container, SUMMARY)

container <- add_as_text(container, "Highlighted as R code")
container <- add_as_code_r(container, SUMMARY)

container <- add_as_text(container, "Output with default `knitr` comments")
container <- add_as_output(container, SUMMARY)

container <- add_as_text(container, "Output with custom comments")
container <- add_as_output(container, SUMMARY, comment = "#$#>")

# Add as text = Add as one paragraph
container <- add_as_heading2(container, "As text/paragraph")
container <- add_as_text(container, SUMMARY)

# Add as-is
container <- add_as_heading2(container, "As is")
container <- add_as_is(container, SUMMARY)
Explore the container
Note, that functions summary(container) and
print(container) do the same action: print summary of the
object
print(container)
#> ================================================================================
#>  *** knitr container ***
#>
#> Contains 26 object(s):
#>
#>    Added.as      Preview                   Size    Classes
#> 1  Heading       # Plots                   0.5 Kb  character
#> 2  Heading       ## Add `plotly` as `pl... 0.5 Kb  character
#> 3  Plotly widget                           32.6 Kb plotly, htmlwidget
#> 4  Heading       ## Add `ggplot` as `pl... 0.5 Kb  character
#> 5  Plotly widget                           88.2 Kb plotly, htmlwidget
#> 6  Heading       ## Add `ggplot` as-is     0.5 Kb  character
#> 7  As is                                   13.9 Kb gg, ggplot
#> 8  Heading       # Attention: Not Plotted  0.5 Kb  character
#> 9  As is                                   32.6 Kb plotly, htmlwidget
#> 10 Text          As you noticed, the la... 0.5 Kb  character
#> 11 Heading       # Print SUMMARY as pan... 0.5 Kb  character
#> 12 Heading       ## As pander table        0.5 Kb  character
#> 13 Pander object                           1.4 Kb  character
#> 14 Heading       ## As Code/ Output Text   0.5 Kb  character
#> 15 Text          Not highlighted           0.3 Kb  character
#> 16 Code          ```        mpg        ... 1.6 Kb  character
#> 17 Text          Highlighted as R code     0.4 Kb  character
#> 18 Code          ```r        mpg       ... 1.7 Kb  character
#> 19 Text          Output with default `k... 0.4 Kb  character
#> 20 Code          ``` #>       mpg      ... 1.6 Kb  character
#> 21 Text          Output with custom com... 0.4 Kb  character
#> 22 Code          ``` #$#>       mpg    ... 1.6 Kb  character
#> 23 Heading       ## As text/paragraph      0.5 Kb  character
#> 24 Text          Min.   :10.40   1st Qu... 0.7 Kb  character
#> 25 Heading       ## As is                  0.5 Kb  character
#> 26 As is                                   3 Kb    table
#> ================================================================================

is.knitrContainer(container)
#> [1] TRUE
is.knitrContainer(ggplot_obj)
#> [1] FALSE

as.knitrContainer(ggplot_obj)
#> ================================================================================
#>  *** knitr container ***
#>
#> Contains 1 object(s):
#>
#>   Added.as Preview Size    Classes
#> 1 As is            13.9 Kb gg, ggplot
#> ================================================================================

class(container)
#> [1] "knitrContainer" "list"
Merge several containers.
Convert (as is) to knitrContainer and merge.
As function uses method “as is” to convert to
knitrContainer, plotly objects might not be
printed from the container in some situations (e.g. from inside
for loops using knitr).
Join(ggplot_obj, plotly_obj)
#> ================================================================================
#>  *** knitr container ***
#>
#> Contains 2 object(s):
#>
#>   Added.as Preview Size    Classes
#> 1 As is            13.9 Kb gg, ggplot
#> 2 As is            32.6 Kb plotly, htmlwidget
#> ================================================================================
In these situations it is better to apply function
add_as_plotly_widget first.
Print objects from the container (print_all)
In section 2 there we demonstrated how to create a
knitr_nontainer. In this section we will demonstrate how to
print all the objects from the container.
For this purpose a special function print_all was
created. As we use knitr and R MArkdown we
recommend to use separate R code chunk to apply the function. It is
IMPORTANT to make sure that R chunk, in
which print_all() is called, has option
results set to as is
({r, results = 'asis'}). Otherwise incorrect results are
expected.
The following text, section headings, figures etc. (except section “ADVANCED: …” and “Session information”) are printed from the container using the following syntax:
print_all(container)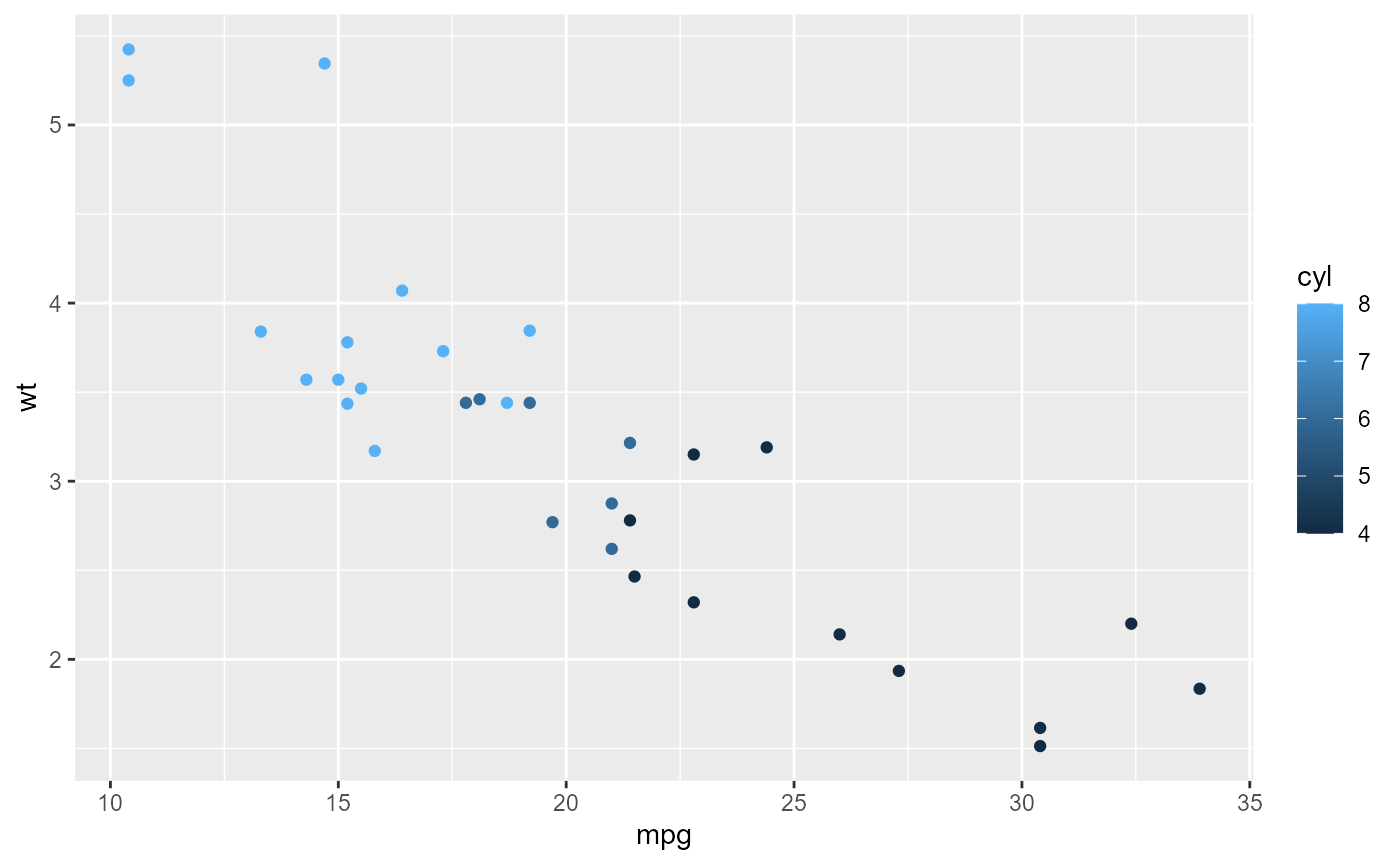
Attention: Not Plotted
As you noticed, the last plotly object was not plotted
as it was added with add_as_is() and not with
add_as_plotly_widget()
Print SUMMARY as pander table and as text
As pander table
| mpg | cyl | disp | hp |
|---|---|---|---|
| Min. :10.40 | Min. :4.000 | Min. : 71.1 | Min. : 52.0 |
| 1st Qu.:15.43 | 1st Qu.:4.000 | 1st Qu.:120.8 | 1st Qu.: 96.5 |
| Median :19.20 | Median :6.000 | Median :196.3 | Median :123.0 |
| Mean :20.09 | Mean :6.188 | Mean :230.7 | Mean :146.7 |
| 3rd Qu.:22.80 | 3rd Qu.:8.000 | 3rd Qu.:326.0 | 3rd Qu.:180.0 |
| Max. :33.90 | Max. :8.000 | Max. :472.0 | Max. :335.0 |
As Code/ Output Text
Not highlighted
       mpg             cyl             disp             hp
  Min.   :10.40   Min.   :4.000   Min.   : 71.1   Min.   : 52.0
  1st Qu.:15.43   1st Qu.:4.000   1st Qu.:120.8   1st Qu.: 96.5
  Median :19.20   Median :6.000   Median :196.3   Median :123.0
  Mean   :20.09   Mean   :6.188   Mean   :230.7   Mean   :146.7
  3rd Qu.:22.80   3rd Qu.:8.000   3rd Qu.:326.0   3rd Qu.:180.0
  Max.   :33.90   Max.   :8.000   Max.   :472.0   Max.   :335.0
Highlighted as R code
       mpg             cyl             disp             hp
  Min.   :10.40   Min.   :4.000   Min.   : 71.1   Min.   : 52.0
  1st Qu.:15.43   1st Qu.:4.000   1st Qu.:120.8   1st Qu.: 96.5
  Median :19.20   Median :6.000   Median :196.3   Median :123.0
  Mean   :20.09   Mean   :6.188   Mean   :230.7   Mean   :146.7
  3rd Qu.:22.80   3rd Qu.:8.000   3rd Qu.:326.0   3rd Qu.:180.0
  Max.   :33.90   Max.   :8.000   Max.   :472.0   Max.   :335.0
Output with default knitr comments
#>       mpg             cyl             disp             hp
#>  Min.   :10.40   Min.   :4.000   Min.   : 71.1   Min.   : 52.0
#>  1st Qu.:15.43   1st Qu.:4.000   1st Qu.:120.8   1st Qu.: 96.5
#>  Median :19.20   Median :6.000   Median :196.3   Median :123.0
#>  Mean   :20.09   Mean   :6.188   Mean   :230.7   Mean   :146.7
#>  3rd Qu.:22.80   3rd Qu.:8.000   3rd Qu.:326.0   3rd Qu.:180.0
#>  Max.   :33.90   Max.   :8.000   Max.   :472.0   Max.   :335.0
Output with custom comments
#$#>       mpg             cyl             disp             hp
#$#>  Min.   :10.40   Min.   :4.000   Min.   : 71.1   Min.   : 52.0
#$#>  1st Qu.:15.43   1st Qu.:4.000   1st Qu.:120.8   1st Qu.: 96.5
#$#>  Median :19.20   Median :6.000   Median :196.3   Median :123.0
#$#>  Mean   :20.09   Mean   :6.188   Mean   :230.7   Mean   :146.7
#$#>  3rd Qu.:22.80   3rd Qu.:8.000   3rd Qu.:326.0   3rd Qu.:180.0
#$#>  Max.   :33.90   Max.   :8.000   Max.   :472.0   Max.   :335.0
As text/paragraph
Min. :10.40 1st Qu.:15.43 Median :19.20 Mean :20.09 3rd Qu.:22.80 Max. :33.90 Min. :4.000 1st Qu.:4.000 Median :6.000 Mean :6.188 3rd Qu.:8.000 Max. :8.000 Min. : 71.1 1st Qu.:120.8 Median :196.3 Mean :230.7 3rd Qu.:326.0 Max. :472.0 Min. : 52.0 1st Qu.: 96.5 Median :123.0 Mean :146.7 3rd Qu.:180.0 Max. :335.0
As is
mpg cyl disp hp Min. :10.40 Min. :4.000 Min. : 71.1 Min. : 52.0
1st Qu.:15.43 1st Qu.:4.000 1st Qu.:120.8 1st Qu.: 96.5
Median :19.20 Median :6.000 Median :196.3 Median :123.0
Mean :20.09 Mean :6.188 Mean :230.7 Mean :146.7
3rd Qu.:22.80 3rd Qu.:8.000 3rd Qu.:326.0 3rd Qu.:180.0
Max. :33.90 Max. :8.000 Max. :472.0 Max. :335.0
ADVANCED: add_as_data and add_as_cmd
container2 <- knitrContainer()
# Add as data and add as code to evaluate

# Add as data
container2 %<>%
    add_as_text("Add `mtcars` as data (it will not be printed) and rename it to 'cars_data'.")
container2 %<>%
    add_as_data(mtcars, give.name = "cars_data")

# Add as code to evaluate
container2 %<>%
    add_as_text(c("Use `add_as_cmd` to add unquoted code which manipulates the dataset ",
        "'cars_data', e.g. prints its variable names or plots it."))
container2 %<>%
    add_as_cmd(print(names(cars_data[1:3])))
container2 %<>%
    add_as_cmd(plot(cars_data[1:3]))
print_all(container2)Add mtcars as data (it will not be printed) and rename
it to ‘cars_data’.
Use add_as_cmd to add unquoted code which manipulates
the dataset ‘cars_data’, e.g. prints its variable names or plots it.
[1] “mpg” “cyl” “disp”

Session information
devtools::session_info()
#> ─ Session info ───────────────────────────────────────────────────────────────
#>  setting  value
#>  version  R version 4.2.3 (2023-03-15 ucrt)
#>  os       Windows 10 x64 (build 19045)
#>  system   x86_64, mingw32
#>  ui       RTerm
#>  language en
#>  collate  English_United States.utf8
#>  ctype    English_United States.utf8
#>  tz       Europe/Helsinki
#>  date     2023-04-11
#>  pandoc   3.1.1 @ C:/Program Files/RStudio/resources/app/bin/quarto/bin/tools/ (via rmarkdown)
#>
#> ─ Packages ───────────────────────────────────────────────────────────────────
#>  package        * version date (UTC) lib source
#>  bslib            0.4.2   2022-12-16 [1] CRAN (R 4.2.2)
#>  cachem           1.0.7   2023-02-24 [1] CRAN (R 4.2.2)
#>  callr            3.7.3   2022-11-02 [1] CRAN (R 4.2.2)
#>  cli              3.6.1   2023-03-23 [1] CRAN (R 4.2.3)
#>  colorspace       2.1-0   2023-01-23 [1] CRAN (R 4.2.2)
#>  crayon           1.5.2   2022-09-29 [1] CRAN (R 4.2.1)
#>  crosstalk        1.2.0   2021-11-04 [1] CRAN (R 4.2.0)
#>  data.table       1.14.8  2023-02-17 [1] CRAN (R 4.2.2)
#>  desc             1.4.2   2022-09-08 [1] CRAN (R 4.2.1)
#>  devtools         2.4.5   2022-10-11 [1] CRAN (R 4.2.1)
#>  digest           0.6.31  2022-12-11 [1] CRAN (R 4.2.2)
#>  dplyr            1.1.1   2023-03-22 [1] CRAN (R 4.2.3)
#>  ellipsis         0.3.2   2021-04-29 [1] CRAN (R 4.2.0)
#>  evaluate         0.20    2023-01-17 [1] CRAN (R 4.2.2)
#>  fansi            1.0.4   2023-01-22 [1] CRAN (R 4.2.2)
#>  farver           2.1.1   2022-07-06 [1] CRAN (R 4.2.1)
#>  fastmap          1.1.1   2023-02-24 [1] CRAN (R 4.2.2)
#>  formatR          1.14    2023-01-17 [1] CRAN (R 4.2.2)
#>  fs               1.6.1   2023-02-06 [1] CRAN (R 4.2.2)
#>  generics         0.1.3   2022-07-05 [1] CRAN (R 4.2.1)
#>  ggplot2        * 3.4.2   2023-04-03 [1] CRAN (R 4.2.3)
#>  glue             1.6.2   2022-02-24 [1] CRAN (R 4.2.0)
#>  gtable           0.3.3   2023-03-21 [1] CRAN (R 4.2.3)
#>  highr            0.10    2022-12-22 [1] CRAN (R 4.2.2)
#>  htmltools        0.5.5   2023-03-23 [1] CRAN (R 4.2.3)
#>  htmlwidgets      1.6.2   2023-03-17 [1] CRAN (R 4.2.3)
#>  httpuv           1.6.9   2023-02-14 [1] CRAN (R 4.2.2)
#>  httr             1.4.5   2023-02-24 [1] CRAN (R 4.2.2)
#>  jquerylib        0.1.4   2021-04-26 [1] CRAN (R 4.2.0)
#>  jsonlite         1.8.4   2022-12-06 [1] CRAN (R 4.2.2)
#>  knitr            1.42    2023-01-25 [1] CRAN (R 4.2.2)
#>  knitrContainer * 0.0.28  2023-04-11 [1] local
#>  labeling         0.4.2   2020-10-20 [1] CRAN (R 4.2.0)
#>  later            1.3.0   2021-08-18 [1] CRAN (R 4.2.0)
#>  lazyeval         0.2.2   2019-03-15 [1] CRAN (R 4.2.0)
#>  lifecycle        1.0.3   2022-10-07 [1] CRAN (R 4.2.1)
#>  magrittr       * 2.0.3   2022-03-30 [1] CRAN (R 4.2.0)
#>  memoise          2.0.1   2021-11-26 [1] CRAN (R 4.2.0)
#>  mime             0.12    2021-09-28 [1] CRAN (R 4.2.0)
#>  miniUI           0.1.1.1 2018-05-18 [1] CRAN (R 4.2.0)
#>  munsell          0.5.0   2018-06-12 [1] CRAN (R 4.2.0)
#>  pander           0.6.5   2022-03-18 [1] CRAN (R 4.2.0)
#>  pillar           1.9.0   2023-03-22 [1] CRAN (R 4.2.3)
#>  pkgbuild         1.4.0   2022-11-27 [1] CRAN (R 4.2.2)
#>  pkgconfig        2.0.3   2019-09-22 [1] CRAN (R 4.2.0)
#>  pkgdown          2.0.7   2022-12-14 [1] CRAN (R 4.2.2)
#>  pkgload          1.3.2   2022-11-16 [1] CRAN (R 4.2.2)
#>  plotly         * 4.10.1  2022-11-07 [1] CRAN (R 4.2.2)
#>  prettyunits      1.1.1   2020-01-24 [1] CRAN (R 4.2.0)
#>  processx         3.8.0   2022-10-26 [1] CRAN (R 4.2.1)
#>  profvis          0.3.7   2020-11-02 [1] CRAN (R 4.2.1)
#>  promises         1.2.0.1 2021-02-11 [1] CRAN (R 4.2.0)
#>  ps               1.7.4   2023-04-02 [1] CRAN (R 4.2.3)
#>  purrr            1.0.1   2023-01-10 [1] CRAN (R 4.2.2)
#>  R6               2.5.1   2021-08-19 [1] CRAN (R 4.2.0)
#>  ragg             1.2.5   2023-01-12 [1] CRAN (R 4.2.2)
#>  Rcpp             1.0.10  2023-01-22 [1] CRAN (R 4.2.2)
#>  remotes          2.4.2   2021-11-30 [1] CRAN (R 4.2.2)
#>  rlang            1.1.0   2023-03-14 [1] CRAN (R 4.2.2)
#>  rmarkdown        2.21    2023-03-26 [1] CRAN (R 4.2.3)
#>  rprojroot        2.0.3   2022-04-02 [1] CRAN (R 4.2.0)
#>  rstudioapi       0.14    2022-08-22 [1] CRAN (R 4.2.1)
#>  sass             0.4.5   2023-01-24 [1] CRAN (R 4.2.2)
#>  scales           1.2.1   2022-08-20 [1] CRAN (R 4.2.1)
#>  sessioninfo      1.2.2   2021-12-06 [1] CRAN (R 4.2.0)
#>  shiny            1.7.4   2022-12-15 [1] CRAN (R 4.2.2)
#>  stringi          1.7.12  2023-01-11 [1] CRAN (R 4.2.2)
#>  stringr          1.5.0   2022-12-02 [1] CRAN (R 4.2.2)
#>  systemfonts      1.0.4   2022-02-11 [1] CRAN (R 4.2.0)
#>  textshaping      0.3.6   2021-10-13 [1] CRAN (R 4.2.0)
#>  tibble           3.2.1   2023-03-20 [1] CRAN (R 4.2.3)
#>  tidyr            1.3.0   2023-01-24 [1] CRAN (R 4.2.2)
#>  tidyselect       1.2.0   2022-10-10 [1] CRAN (R 4.2.1)
#>  urlchecker       1.0.1   2021-11-30 [1] CRAN (R 4.2.1)
#>  usethis          2.1.6   2022-05-25 [1] CRAN (R 4.2.0)
#>  utf8             1.2.3   2023-01-31 [1] CRAN (R 4.2.2)
#>  vctrs            0.6.1   2023-03-22 [1] CRAN (R 4.2.3)
#>  viridisLite      0.4.1   2022-08-22 [1] CRAN (R 4.2.1)
#>  withr            2.5.0   2022-03-03 [1] CRAN (R 4.2.0)
#>  xfun             0.38    2023-03-24 [1] CRAN (R 4.2.3)
#>  xtable           1.8-4   2019-04-21 [1] CRAN (R 4.2.0)
#>  yaml             2.3.7   2023-01-23 [1] CRAN (R 4.2.2)
#>
#>  [1] C:/Users/ViG/AppData/Local/R/win-library/4.2
#>  [2] C:/Program Files/R/R-4.2.3/library
#>
#> ──────────────────────────────────────────────────────────────────────────────